
















10 Key SaaS Metrics Every Business Should Track

KEY TAKEWAYS:
- Key SaaS metrics connect revenue, retention, acquisition, and product usage so teams can see whether subscription growth is healthy or only temporarily increasing.
- The core dashboard should separate MRR, ARR, churn, NRR, LTV, CAC, payback, ARPU, and NPS instead of blending them into one vague growth number.
- Stage matters: early SaaS teams need activation and retention signals, growth-stage teams need unit economics, and enterprise or AI SaaS products need deeper usage, margin, and reliability metrics.
- Metrics become useful only when they drive specific product and revenue decisions, such as improving onboarding, fixing churn causes, changing packaging, or prioritizing high-value segments.
- Reliable SaaS reporting requires clean billing, CRM, product, support, and finance data with clear definitions, ownership, and review cadence.
Key SaaS metrics turn subscriptions, upgrades, downgrades, cancellations, acquisition spending, and customer sentiment into evidence a team can act on. The right set shows whether recurring revenue is growing, whether customers keep receiving value, and whether the company can afford its growth. The wrong set creates an attractive dashboard that explains very little.
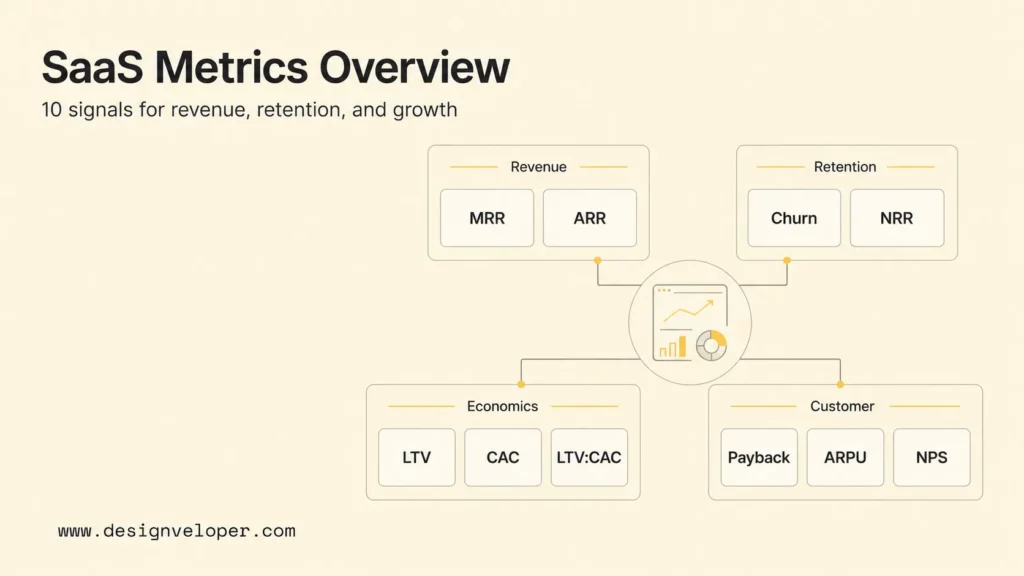
The ten metrics in this guide form a connected system. MRR and ARR describe recurring revenue; churn and NRR explain how the installed customer base changes; LTV, CAC, the LTV:CAC ratio, and CAC payback test unit economics; ARPU or ARPA reveals monetization; and NPS adds a customer-perception signal. None should be interpreted alone.
Quick decision guide: If revenue predictability is unclear, start with MRR and its new, expansion, contraction, and churn components. If growth is expensive, pair CAC with payback and LTV:CAC by segment. If customers are leaving, compare customer churn, revenue churn, NRR, product usage, support signals, and NPS. Keep one definition, owner, source, and review cadence for every metric.
| Business question | Metrics to open first | Decision they support |
|---|---|---|
| Is recurring revenue growing predictably? | MRR, ARR, NRR | Forecasting, targets, hiring, and investment |
| Are customers staying and expanding? | Customer churn, revenue churn, NRR, NPS | Retention, customer success, and product priorities |
| Can we scale acquisition efficiently? | CAC, LTV, LTV:CAC, CAC payback | Channel budgets, sales capacity, and segment focus |
| Are we monetizing the right accounts? | ARPU/ARPA, expansion MRR, contraction MRR | Packaging, pricing, and account development |
Recommended for you:
- How To Build An App For Your Business: A Practical Guide
- Web Application Development Cost: Key Factors And Estimates
- How Long Does It Take To Build A Web App?
Why SaaS Metrics Matter
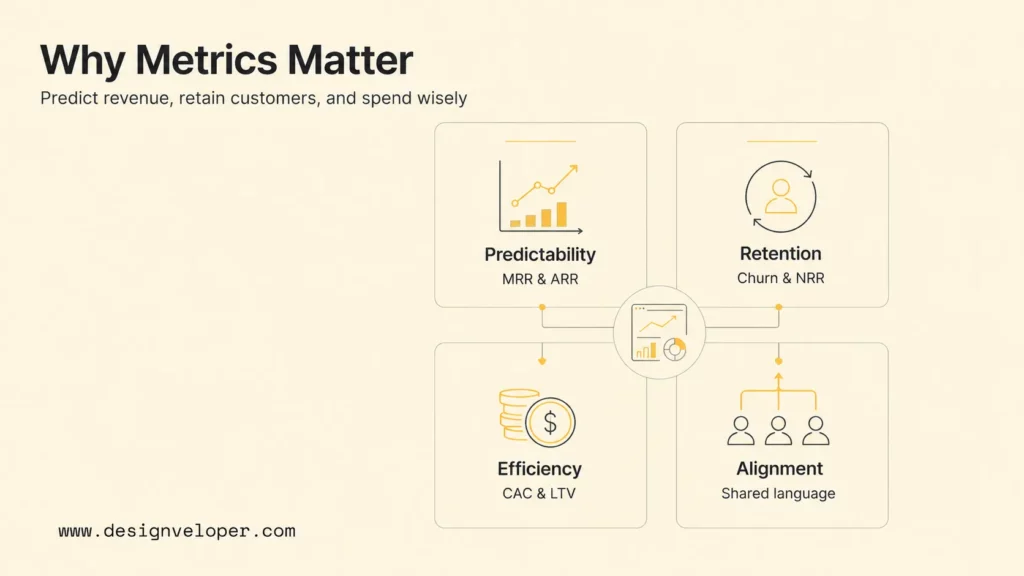
A SaaS company recognizes value over an ongoing customer relationship. That makes a new sale only the beginning of the economic story. A customer may activate, expand, downgrade, pause, fail a payment, or cancel. A useful measurement system records these events consistently and relates them to the product experience that caused them.
First, SaaS metrics improve revenue predictability. MRR normalizes recurring contracts into a monthly view, while ARR provides an annualized run-rate perspective. They help operators distinguish recurring subscription value from implementation fees, one-time services, taxes, and other nonrecurring items. Stripe also notes that MRR is a business performance measure rather than GAAP revenue, an important distinction for finance and operating teams.
Second, retention metrics reveal whether the product keeps delivering value. Customer churn counts lost customers, revenue churn weights those losses by recurring revenue, and NRR includes expansion and contraction. A company can grow new sales while an unhealthy installed base leaks value. Segmenting retention by start month, plan, industry, company size, use case, or acquisition source shows where that leak begins.
Third, acquisition efficiency determines whether growth creates or consumes economic value. CAC without LTV can make a low-cost channel look attractive even when it attracts short-lived customers. LTV without payback can hide a cash-flow problem: the expected value may be high, but the company might wait too long to recover acquisition spending. Reviewing the trio together makes budget choices more defensible.
Finally, a shared metric language aligns product, customer success, marketing, sales, finance, and leadership. The team must still agree on boundaries: what qualifies as active, which costs belong in CAC, whether usage charges are recurring, how reactivations are treated, and when a cancellation enters the denominator. A formula is only comparable when the underlying policy is stable.
10 Key SaaS Metrics And Formulas
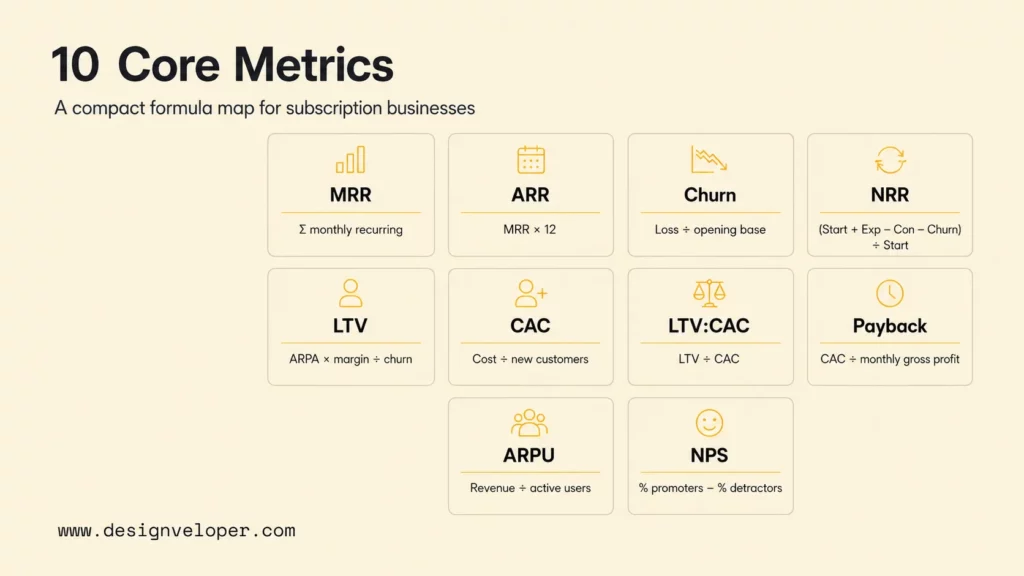
Reader asset: use the metrics as one operating system. A movement in one node should trigger investigation in the adjacent nodes.
| Metric | What It Measures | Basic Formula | Why It Matters |
|---|---|---|---|
| MRR | Monthly recurring subscription value | Sum of monthly-normalized recurring revenue | Shows current recurring momentum |
| ARR | Annualized recurring run rate | MRR x 12 | Supports annual planning and reporting |
| Churn rate | Customers or revenue lost | Losses / opening base x 100 | Reveals retention pressure |
| NRR | Existing-base revenue after movement | (Opening recurring revenue + expansion – contraction – churn) / opening recurring revenue x 100 | Combines retention and expansion |
| LTV | Expected value over a relationship | ARPA x gross margin / revenue churn rate | Frames sustainable acquisition spending |
| CAC | Cost to acquire a new customer | Acquisition costs / new customers | Measures acquisition efficiency |
| LTV:CAC | Value relative to acquisition cost | LTV / CAC | Tests unit economics |
| CAC payback | Months to recover CAC | CAC / monthly gross profit per new customer | Shows cash recovery speed |
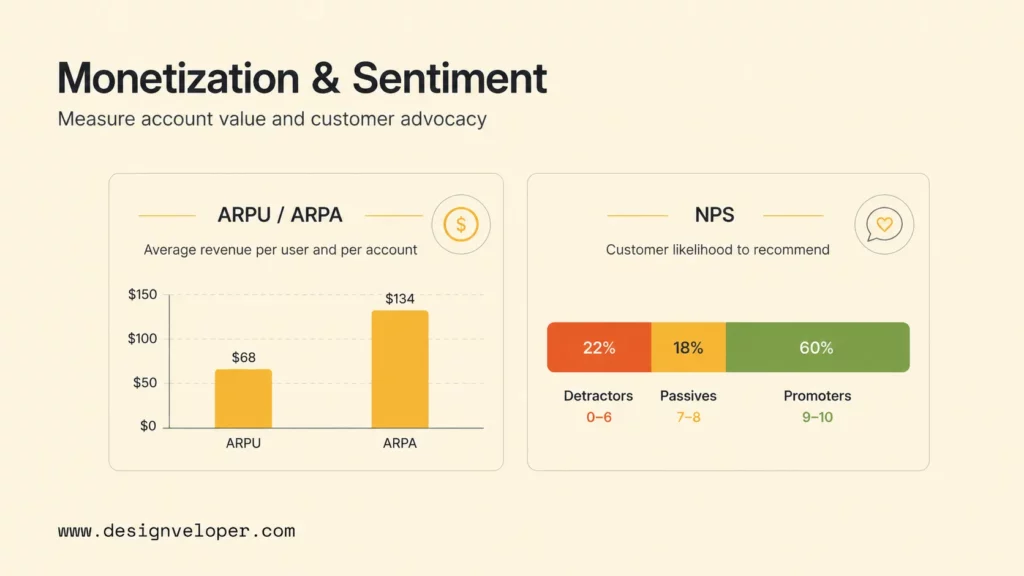
| ARPU/ARPA | Average recurring revenue per user or account | Recurring revenue / active users or accounts | Tracks monetization and mix |
| NPS | Likelihood to recommend | % promoters – % detractors | Adds a perception and advocacy signal |
1. Monthly Recurring Revenue (MRR)
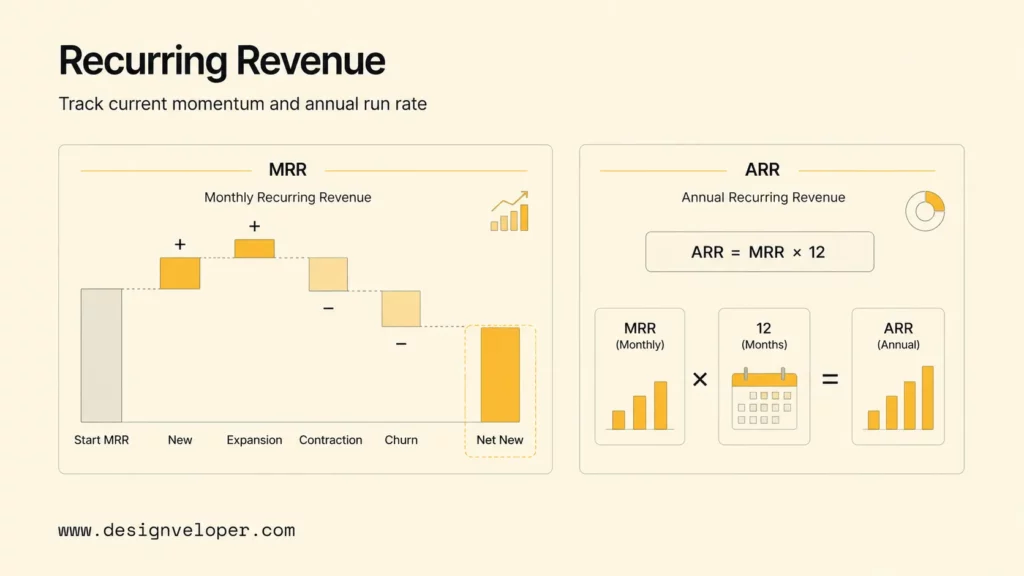
MRR is the monthly-normalized recurring value of active subscriptions. For a simple monthly plan, multiply active accounts by the monthly price. For annual, quarterly, or multiyear contracts, normalize recurring contract value to one month before summing it. Exclude taxes, setup charges, hardware, and one-time professional services unless the company has a documented recurring-revenue policy that treats a component differently.
The total is less useful than its movement. New MRR comes from first-time customers; expansion MRR comes from upgrades, added seats, or increased usage; contraction MRR comes from downgrades; churned MRR comes from cancellations. Net new MRR equals new plus expansion minus contraction and churn. This bridge tells leaders whether growth comes from acquisition or from deeper value within existing accounts.
Define the effective date of every movement. Billing systems, CRM records, and the general ledger may record the same event differently. Failed payments also need a policy: distinguish involuntary churn and temporary delinquency from a deliberate cancellation. Stripe’s MRR and ARR guidance describes MRR as the monthly-normalized amount of active and past-due subscriptions, but each team must document the definition used in its own reporting stack.
2. Annual Recurring Revenue (ARR)
ARR annualizes the current recurring revenue base. In a consistent subscription model, ARR is commonly calculated as MRR multiplied by 12. It is useful for annual planning, long-term targets, investor communication, and comparing companies whose billing schedules differ. It is a run-rate measure, not a promise that the same customers and prices will remain for twelve months.
ARR should follow the same inclusion rules as MRR. Do not quietly add signed but not yet activated contracts, expected renewals, usage that has not occurred, or nonrecurring services. If committed annual recurring revenue is reported separately, label it clearly and reconcile it to live ARR. For seasonal or consumption-heavy products, an annualized snapshot can swing, so leaders should also review cohorts, usage, remaining performance obligations where relevant, and historical seasonality.
3. Churn Rate
Customer churn rate measures the percentage of customers lost from the opening customer base during a period: customers lost divided by customers at the start, multiplied by 100. Revenue churn rate measures recurring revenue lost through cancellations and sometimes contractions, divided by opening recurring revenue. State whether contraction is included, because gross revenue churn definitions differ across dashboards.
The two rates answer different questions. Losing ten small accounts can produce high logo churn but limited revenue churn. Losing one large enterprise customer can produce the opposite pattern. Both should be segmented by plan, tenure, cohort, industry, acquisition source, and reason. Monthly churn also compounds; a seemingly modest monthly loss can materially reduce the retained base over a year.
Do not treat churn as one product problem. Voluntary churn may reflect weak fit, value, onboarding, support, pricing, or competition. Involuntary churn can come from failed payments. Contraction may signal budget pressure or unused capacity. Connect the metric to cancellation feedback, product events, support tickets, payment recovery, and customer-success activity so the team can identify an intervention.
4. Net Revenue Retention (NRR)
NRR measures how recurring revenue from an opening customer cohort changes after expansion, contraction, and churn, excluding new customers. The basic formula is opening recurring revenue plus expansion, minus contraction and churn, divided by opening recurring revenue, multiplied by 100. An NRR above 100% means expansion from retained customers outweighed lost and reduced revenue during the period.
Because NRR blends several movements, always publish the bridge beside the percentage. A price increase might lift NRR while logo retention deteriorates. One large expansion can hide weakness in many smaller accounts. Gross revenue retention, which excludes expansion, provides the floor created by renewal, downgrade, and churn behavior. Stripe’s current NRR guide emphasizes that benchmarks vary by industry and business model, so compare the company with its history and relevant peers rather than using one universal target.
A retention percentage becomes actionable only when the team can see which customers expanded, contracted, or left – and why.
5. Customer Lifetime Value (LTV)
LTV estimates the economic value generated by an average customer relationship. A useful simplified SaaS formula is average recurring revenue per account multiplied by gross margin percentage, divided by revenue churn rate for the same period. Another approach models expected gross profit from actual cohorts. Cohort-based models are preferable when retention changes by tenure, customers differ greatly, or usage revenue is volatile.
LTV is an estimate, not cash in the bank. Small changes in churn can create very large changes in a simplified formula, especially when churn is close to zero. Do not extrapolate an early cohort indefinitely or combine enterprise and self-service customers into one average. Calculate LTV by meaningful segment and show the observation window, margin treatment, and uncertainty.
Use LTV to compare customer groups, channel quality, onboarding outcomes, and pricing choices. It becomes more credible when the forecast is reconciled with realized gross profit over time. A rising LTV can come from better retention, higher ARPA, expansion, or margin improvement; each cause suggests a different action.
6. Customer Acquisition Cost (CAC)
CAC equals sales and marketing acquisition costs divided by new customers acquired during a defined period. The numerator may include advertising, sales and marketing payroll, commissions, agencies, tools, events, content, and allocated overhead. The denominator must use customers attributable to the corresponding acquisition activity, with an appropriate lag for longer sales cycles.
Blended CAC covers all acquisition sources; paid CAC isolates paid programs. Both can be helpful when clearly labeled. Segment CAC by channel, geography, customer size, and sales motion because an enterprise contract and a self-service subscription require different effort. A low CAC is not automatically good: a channel that acquires poorly fitting customers can later produce high churn, support cost, and low LTV.
Measure sales-cycle length and conversion alongside CAC. If costs occur this quarter but customers close next quarter, a simple same-period calculation distorts efficiency. A cohort or trailing-period method can align spend and outcomes more honestly. Document changes in attribution and cost allocation before comparing the trend.
7. LTV:CAC Ratio
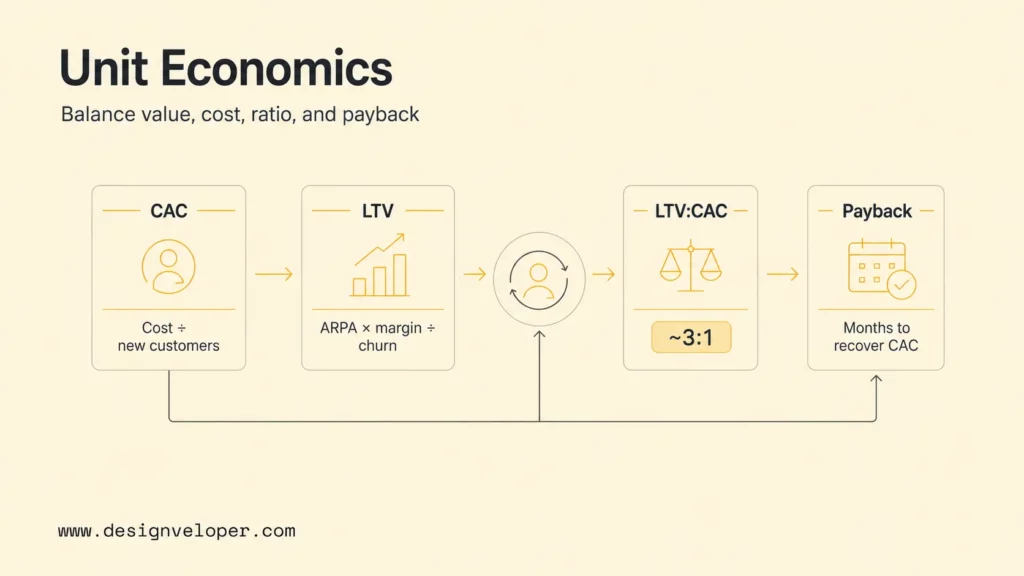
The LTV:CAC ratio divides estimated customer lifetime value by acquisition cost. It summarizes how much expected gross-profit value the company generates for each unit spent to acquire a customer. A result of 3:1 means the estimated LTV is three times CAC. Stripe describes 3x or more as a common sign of potentially sustainable growth, but it is a heuristic, not a law.
A very low ratio can indicate high acquisition cost, weak retention, low pricing, or poor gross margin. A very high ratio may look efficient, but it could mean the company is underinvesting in a channel with room to scale. The calculation also inherits every assumption and error in LTV and CAC. Review the underlying retention, margin, channel, and cohort data before acting on the ratio.
Use LTV:CAC to compare reasonably similar segments and acquisition motions. Do not compare a forecast-heavy early cohort with a mature cohort without qualification. Pair the ratio with payback, growth, customer concentration, and cash constraints. An attractive long-run ratio does not solve a short-run funding gap.
8. CAC Payback Period
CAC payback estimates how many months of gross profit are required to recover acquisition spending. A basic formula is CAC divided by monthly ARPA multiplied by gross margin percentage. For example, a $1,200 CAC and $120 in monthly gross profit implies a ten-month payback, assuming the customer remains and the contribution pattern is stable.
Payback makes the cash timing visible. Two segments may have the same LTV:CAC ratio but very different recovery periods. The longer one requires more working capital and carries more risk that the customer churns before the initial spend is recovered. Commissions paid upfront, onboarding cost, delayed activation, ramping seat counts, and usage variability may require a cash-flow schedule instead of a single division.
Track payback by cohort and channel, then compare expected with realized recovery. Shortening payback can come from lower acquisition cost, faster conversion, higher initial ARPA, improved margin, or expansion. Discounting a contract might accelerate closing while extending payback, so sales incentives should reflect both bookings and durable economics.
9. Average Revenue Per User Or Account (ARPU/ARPA)
ARPU divides recurring revenue by active users; ARPA divides it by active accounts. Choose the denominator that matches how the product is bought and managed. A consumer subscription may make sense per user, while a B2B platform with many seats should normally use accounts and separately track seats, usage, and revenue per seat.
ARPU or ARPA helps explain pricing, packaging, segment mix, and expansion. An increase can reflect upgrades, added seats, consumption, price changes, or the loss of lower-value customers. A decrease may be intentional if a lower-priced tier opens a valuable segment. Report the distribution or segment values beside the average so a few large accounts do not hide the typical experience.
Keep the period and revenue scope consistent with MRR. Usage-based SaaS may need committed recurring revenue, actual consumption, and minimum contract value as separate views. Product teams can connect ARPA movement to feature adoption and account maturity to learn which outcomes customers will pay to expand.
10. Net Promoter Score (NPS)
NPS asks how likely a respondent is to recommend the company or product on a zero-to-ten scale. Respondents scoring nine or ten are promoters, seven or eight are passives, and zero through six are detractors. The score equals the percentage of promoters minus the percentage of detractors, producing a range from -100 to 100.
NPS is a perception signal, not a substitute for retention, revenue, or behavioral data. Response bias, survey timing, relationship stage, sample size, and cultural differences affect results. Show response count and rate, segment the feedback, and read the comments. A score without the reasons behind it offers little product direction.
Close the loop with respondents and categorize themes such as onboarding, reliability, missing capability, service, price, and outcome. Then compare themes with usage and renewal behavior. A detractor who owns a strategic account and has declining use deserves different intervention from a new free user who has not activated.
Further reading:
- Software Development Costs: Key Factors, Ranges, And Planning Tips
- Types Of Software Development Services: A Practical Guide For Businesses
- Custom Web Application Development Companies: How To Choose The Right Partner
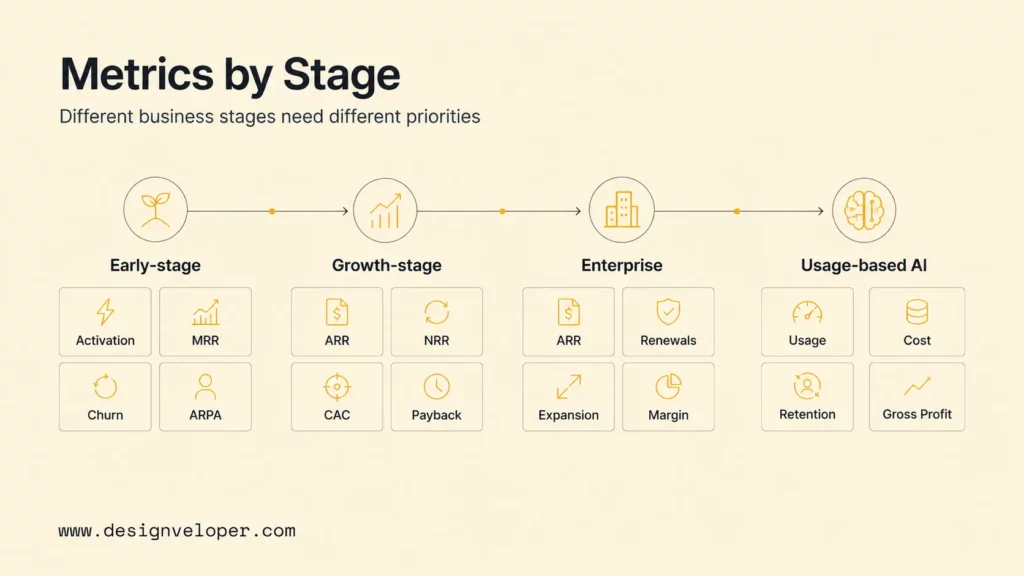
SaaS Metrics By Business Stage
| Stage | Metrics To Prioritize | Why |
|---|---|---|
| Early-stage SaaS | Activation evidence, MRR composition, customer churn, usage, ARPA, qualitative feedback, runway | Validate that a specific customer repeatedly reaches value before optimizing a forecast-heavy LTV model |
| Growth-stage SaaS | ARR growth, NRR and GRR, cohort retention, CAC, LTV:CAC, CAC payback, expansion MRR | Scale the strongest segments and channels without hiding retention or cash inefficiency |
| Enterprise SaaS | ARR, NRR, GRR, renewal pipeline, concentration, multi-product expansion, gross margin, implementation health | Manage long contracts, complex deployments, large-account exposure, and renewal risk |
| AI-enabled or usage-based SaaS | Committed and consumed revenue, usage cohorts, contribution margin, inference cost, retention, expansion, reliability | Connect variable consumption and compute cost to customer value and durable economics |
Early-stage teams need fast learning more than benchmark theater. With a small base, one customer can move every percentage. Track whether target users activate, return, pay, and describe a repeatable outcome. Keep MRR movement and cash visible, but avoid presenting a fragile LTV estimate as precision.
Growth-stage teams need segmentation and discipline. Acquisition expands, sales motions multiply, and old cohorts have enough history to test retention. This is the time to connect channel CAC to cohort NRR and payback, then move budget toward combinations that retain. SaaS Capital’s 2025 private B2B SaaS growth research also shows how growth relates to factors including company size and retention, reinforcing the need for peer-appropriate comparison.
Enterprise SaaS adds implementation, renewal pipeline, concentration, security, and stakeholder adoption. A contract can remain active while product use falls, creating a delayed churn signal. AI-enabled and usage-based products add another layer: consumption may grow while contribution margin falls because inference, data, or infrastructure cost rises. Track value events, consumed units, unit cost, contracted minimums, and gross profit together.
Related reading:
- AI Driven Decision Making: Benefits, Risks, And Business Use Cases
- AI Business Process Automation: Benefits, Use Cases, And How To Start
- Small Business Applications: Practical Software Ideas And Use Cases
How To Use SaaS Metrics To Improve Growth
Start with retention before accelerating acquisition. Segment churn and NRR, identify where successful and unsuccessful cohorts diverge, and inspect onboarding, adoption, support, reliability, and payment events. A lifecycle view often finds a specific moment – failure to complete setup, invite teammates, import data, or use a core feature – that predicts later cancellation.
Next, separate every MRR movement. Assign owners and reasons to new, expansion, contraction, reactivation, and churned MRR. Review the bridge each month and the underlying accounts each week where volume permits. Expansion can guide packaging and customer-success plays; contraction can expose unused seats, weak adoption, or budget pressure.
Before increasing sales spend, compare CAC, payback, and realized retention by channel and segment. Build a cohort matrix that follows gross profit rather than only signups. If a channel closes quickly but produces weak activation and early churn, improve targeting and onboarding before buying more traffic. If a high-CAC enterprise segment retains and expands strongly, a longer payback may still fit the strategy and cash plan.
Use NPS and product usage to identify retention risks, but create interventions that can be tested. Examples include guided onboarding, lifecycle education, in-product alerts, payment recovery, account reviews, plan redesign, and reliability work. Compare treated and untreated groups when possible, measure unintended effects, and keep the causal claim narrower than the evidence.
Build dashboards around decisions. An executive view can show ARR, its movement, NRR, GRR, CAC payback, and cash context. Product and customer-success views should expose cohorts, activation, feature adoption, account health, churn reasons, and intervention outcomes. Each chart should have an owner, freshness indicator, definition, segment filters, and an action threshold.
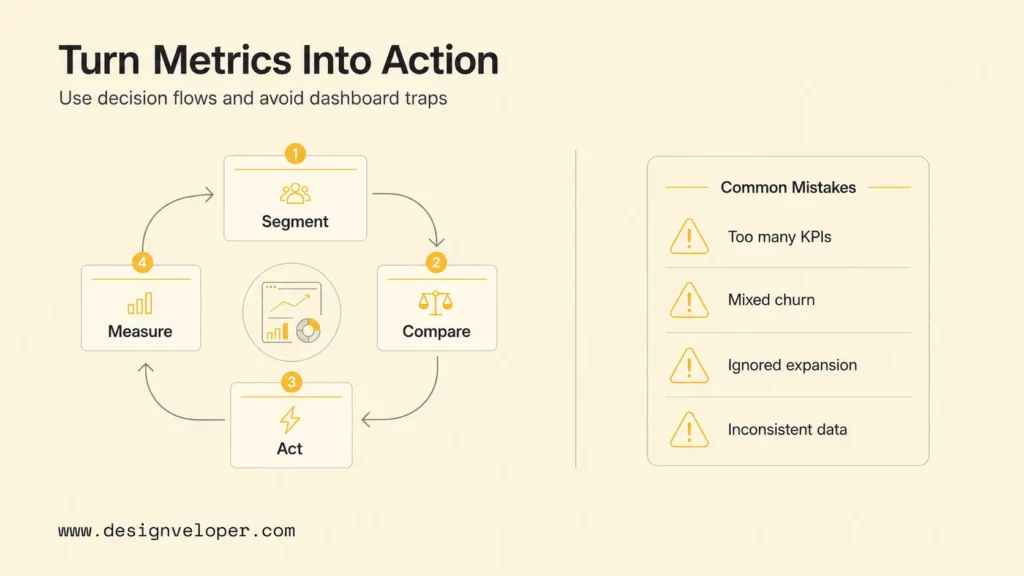
Common Mistakes When Tracking SaaS Metrics
The first mistake is tracking too many metrics without a decision. A dashboard grows because each team adds a number, but nobody removes one or defines the response to a change. Use a compact core scorecard and let diagnostic views sit underneath it. Every core metric should answer who acts, how quickly, and what evidence they inspect next.
The second is mixing customer churn and revenue churn. The same label can cause leaders to misunderstand whether the company lost many small customers or a few large ones. Label the denominator, show both, and add GRR and NRR when expansion matters. Never put percentages with different periods on the same chart without conversion and explanation.
The third is ignoring expansion revenue. Total MRR can rise even when new sales slow because existing customers upgrade, and it can remain flat while severe churn is masked by one expansion. The MRR bridge prevents both errors. The fourth is using inconsistent data sources. Billing, CRM, product analytics, support, and finance systems need stable customer and account identifiers plus reconciliation rules.
The fifth is measuring revenue without product usage or retention context. A signed contract does not prove adoption. Pair commercial measures with value events specific to the product. Also avoid universal benchmark claims: retention and payback differ between self-service, SMB, mid-market, enterprise, vertical, and usage-based products. ChartMogul’s recent SaaS retention research segments results by scale and subscriber count, illustrating why context matters.
The best SaaS dashboard is not the one with the most numbers; it is the one that makes the next decision obvious and auditable.
SaaS Metrics Systems That Support Product Decisions
A dependable metrics system starts with an event and entity model. Define customer, account, workspace, subscription, plan, user, contract, invoice, payment, and product event. Give each a durable identifier. Record effective dates and preserve history so a backdated cancellation, plan migration, or account merge does not silently rewrite prior reporting.
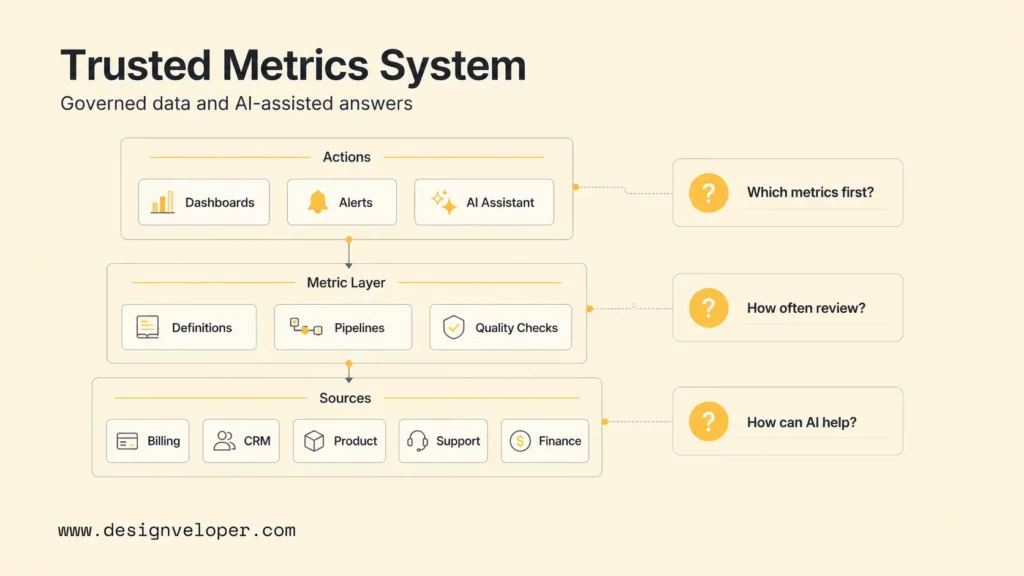
Then connect billing, CRM, product analytics, support, and finance data through tested pipelines. Maintain a metric catalog with formula, owner, source fields, exclusions, time zone, currency conversion, refresh rate, and expected reconciliation. Automated quality checks can flag missing accounts, duplicate subscriptions, impossible dates, delayed events, sudden distribution changes, and totals that do not match the billing source.
At Designveloper, we can help SaaS teams design and build this operational layer as part of a broader software development engagement. That can include subscription and product integrations, customer-facing workflows, internal dashboards, data services, account-health signals, and AI-assisted analysis. The goal is not another isolated reporting screen; it is a system that connects a metric change to the account, behavior, and team workflow needed to respond.
AI can summarize account histories, detect unusual movement, classify feedback, explain dashboard changes, and propose questions. It should not invent a causal conclusion. Ground analysis in governed data, expose the calculation and evidence, control access, and keep approval around high-impact actions. Deterministic code should calculate the metric; an AI layer can help people investigate it.
We recommend starting with one decision flow, such as reducing first-90-day churn. Define the cohort and outcome, integrate only the required sources, create the diagnostic view, route risky accounts to an owner, and measure intervention results. Once the workflow proves useful, extend the same governed foundation to expansion, acquisition efficiency, forecasting, and pricing.
Explore more:
- POC Vs MVP Vs Prototype: Key Differences And When To Use Each
- What Is AI Automation? Benefits, Examples, And How It Works
- AI Tools For Developers: Practical Options For Modern Software Teams
FAQs About Key SaaS Metrics
Which SaaS Metrics Should Startups Track First?
Start with a small set tied to product-market learning: activation or a product-specific value event, active paying customers, MRR and its movement, customer churn, revenue churn, ARPA, runway, and structured customer feedback. Add CAC and payback when acquisition becomes repeatable. Use LTV cautiously until cohorts have enough history to support the retention assumption.
What Is A Good LTV:CAC Ratio For SaaS?
Around 3:1 is a widely cited heuristic, but a good ratio depends on growth stage, gross margin, cash, payback, retention confidence, segment, and sales motion. A lower ratio needs investigation; a much higher one may indicate underinvestment. Compare like-for-like cohorts and inspect the LTV and CAC assumptions instead of managing to the ratio alone.
How Often Should SaaS Metrics Be Reviewed?
Operational signals such as payments, activation, reliability, and account risk may need daily or weekly review. MRR movement, churn, NRR, CAC, and payback usually support a formal monthly review. Strategy, pricing, and long-term cohort economics can be reviewed quarterly. Match cadence to how quickly the team can act and avoid overreacting to noise.
What Is The Difference Between NRR And GRR?
NRR includes expansion, contraction, and churn from the opening customer base. GRR includes contraction and churn but excludes expansion, so it normally cannot exceed 100%. NRR shows whether expansion offsets losses; GRR shows the retention floor before upsells. Reviewing both prevents strong expansion from hiding customer or revenue loss.
How Can AI Help Analyze SaaS Metrics?
AI can classify feedback, summarize account history, surface anomalies, translate natural-language questions into governed queries, and help explain metric movements. It works best above a trusted semantic and data layer. Keep formulas deterministic, require citations to source records, test the assistant against known cases, protect account permissions, and have people approve consequential recommendations or actions.
Also published on

Share post on










Related Articles



30 Best Web Development Blogs To Follow In 2026
30 Best Web Development Blogs To Follow In 2026 Published July 30, 2026
10 Key SaaS Metrics Every Business Should Track
10 Key SaaS Metrics Every Business Should Track Published July 28, 2026
Business Intelligence Examples: 10 Inspiring Use Cases for 2026
Business Intelligence Examples: 10 Inspiring Use Cases for 2026 Published May 04, 2026