


10 Best JavaScript Charting Libraries: A Comprehensive List
When it comes to data visualization, there are a plethora of libraries available. A JavaScript charting library can make your data analysis and presentation much easier. But which one is the best? This article aims to provide a comprehensive list of the best JavaScript charting libraries. We’ll also include a few tips on how to use a JavaScript chart library to improve your data visualization skills.
So without further ado, let’s get started!

Why Do You Need a JavaScript Charting Library?
A JavaScript charting library can make data analysis and presentation much easier. They allow you to create interactive charts with a simple codebase and can be used with a range of data sources.
These libraries can be used to visualize data from a range of sources, including HTML documents, JSON files, and databases. They can also create charts that are interactive and shareable.
A graph maker like Google Charts can create sophisticated and professional-looking charts. But if you’re just looking to get started, a JavaScript charting library is a great option.
What are the Best JavaScript Charting Libraries?
Here are the 10 best JavaScript charting libraries, based on our comprehensive research.
1. FusionCharts
FusionCharts is a popular JavaScript charting library that is used by a range of organizations. It has a simple codebase and is easy to use, making it a great option for beginners.
Some features that make FusionCharts stand out include its wide range of chart types, from creating pie charts to mapping data. It also has a wide range of features for data analysis and presentation, making it a versatile library.
FusionCharts is also popular for its online tools, including the ability to create charts in a drag-and-drop format. This makes it easy to create charts quickly and share them with others.
2. Chart.js
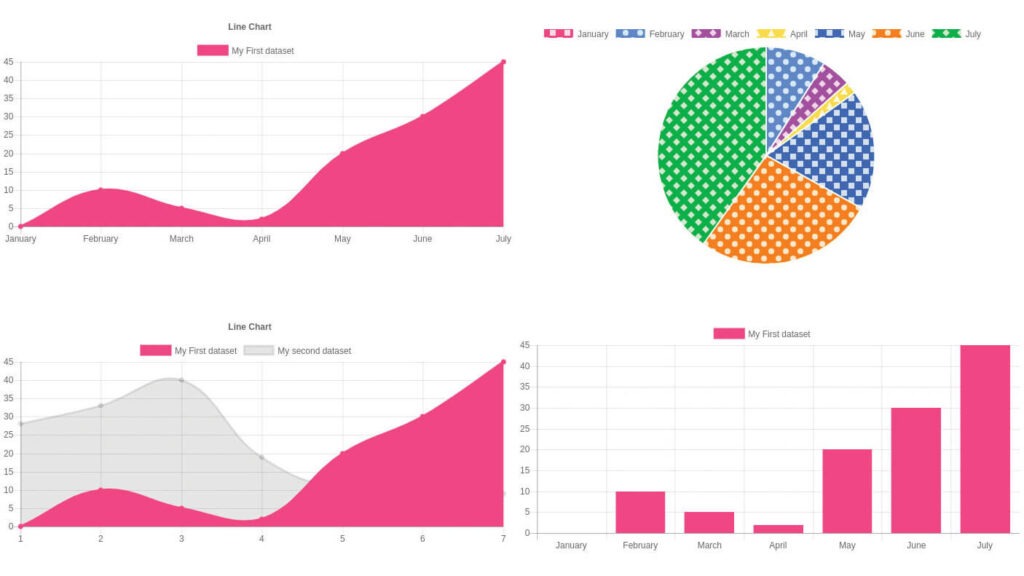
This open-source library is popular for its simplicity. It offers a range of features, including data manipulation, interactive charts, and support for multiple data sources. Chart.js is easy to use and can be integrated into web pages with a simple codebase.
One downside is that Chart.js is not as sophisticated as some of the other libraries on this list. But it’s a great option if you’re just starting out, and want to get started quickly.
Recommended reading: Java Developer Hiring Guide: Offer Tips and Strategies
3. D3.js
D3.js is a popular library for data visualization. It offers a range of features, including data transformation, animation, and interactive charts. D3.js is versatile and can create complex charts and graphs.
However, D3.js can be complex to learn and may require some specialist knowledge to use effectively. It may also not be as readily available in your preferred language or platform.
4. Dygraphs
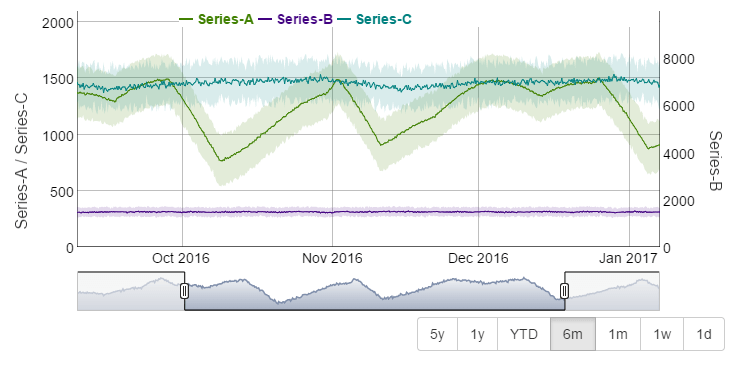
Fast, stable, and highly configurable, Dygraphs is a great choice if you’re looking for a robust JavaScript charting library. It has a wide range of features, including support for data sources. However, Dygraphs is a bit more complicated to use than some of the other options.
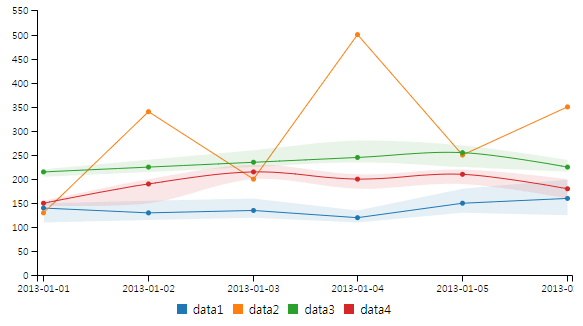
5. Recharts
Recharts is a popular choice for data visualization and is perfect if you’re looking for an easy-to-use library with a wide range of features. Additionally, Recharts is highly configurable and can be used to create complex charts. One drawback is that Recharts is not as fast as some of the other options.
6. Billboard.js
Creating an organizational chart with Billboard.js is a breeze. It’s fast and easy to use and has a wide range of features. However, the performance may not be the best for larger charts.
7. ApexCharts.js
ApexCharts.js has many color schemes and options for customization, making it a powerful tool for data visualization. It also has a wide range of features, including support for data series, tooltip generation, and event handling.
One drawback, however, is that ApexCharts.js is not as fast as some of the other libraries on this list. Some users have also complained about the slow response time.
8. Vis.js
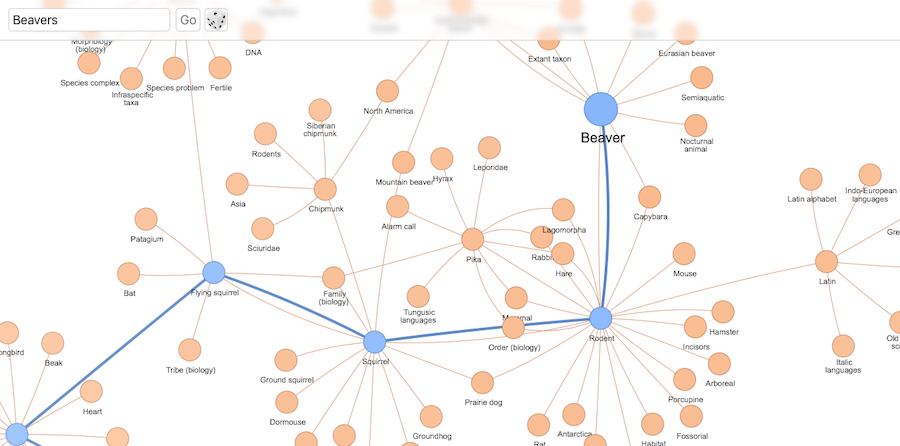
For 2D and 3D charts, Vis.js is a great choice. It’s easy to use and comes with a range of features, including support for animation and interaction. However, integrating Vis.js into your web project can be tricky, and it’s not the most popular library on the market.
9. Highcharts
Highcharts is a well-known and popular JavaScript charting library. It’s easy to use and has a range of features, including support for data sources such as JSON and XML. But the cost of licensing can be a downside for some users.
10. C3.js
C3.js is free to use and has a simple, easy-to-use interface. It’s also versatile and can create charts that are interactive and shareable. However, working on large projects can be difficult with C3.js.
How to Use a JavaScript Charting Library to Improve Your Data Visualization Skills?
If you’re new to data visualization, a JavaScript charting library can be a significant starting point. Here are a few tips on how to use a JavaScript charting library to improve your data visualization skills:
1. Start with a Simple Chart
Before you build more complex charts, it’s helpful to start with a simple one. This will help you get acquainted with the library and learn how to use it.
2. Customize Your Charts
Once you have a basic understanding of how a JavaScript charting library works, you can start customizing your charts to better represent your data. Use the library’s built-in features and customize them to suit your needs.
3. Use Symbols and Legends
Many JavaScript charting libraries include symbols and legends that you can use to enhance your data visualization. Add them to your charts to make them more informative.
4. Use Visualization Techniques
Finally, don’t be afraid to use visualization techniques to create more impactful charts. Try using color, shape, and layout to make your charts more interesting and engaging.
Ready to Improve Your Data Visualization Skills?
JavaScript libraries are a great way to improve your data visualization skills. From here, you’ll be able to create more sophisticated charts and presentations with ease.
FusionCharts provides a wide range of features, including interactive charts, 3D charts, and powerful data analysis tools. Create stunning charts and graphs with no prior experience required.
Download FusionCharts and start creating stunning charts today!
Words from Designveloper on JavaScript Charting Libraries
As a leading web & software development company in Vietnam, Designveloper has extensive experience in leveraging these libraries to deliver top-notch solutions. In this section, we’ll share our preferred libraries, successful use cases, and thoughts on future trends. Our aim is to provide you with a comprehensive understanding of how we, at Designveloper, utilize JavaScript Charting Libraries to meet diverse client needs. Let’s dive in!
Preferred JavaScript Charting Library
At Designveloper, we have a clear favorite when it comes to JavaScript Charting Libraries – Chart.js. This preference stems from two main reasons:
- Simplicity: Chart.js stands out for its simplicity. The library offers straightforward APIs, making it an ideal choice for both beginners and time-pressed developers. Unlike other libraries such as D3.js or Google Chart, which offer powerful customization but require a steep learning curve, Chart.js provides a range of basic and popular charts that cater to most developers’ needs.
- Comprehensive Documentation: Chart.js shines in its documentation. The library provides clear, detailed, and easy-to-understand guides, enabling users to quickly learn how to use it effectively.
These factors make Chart.js our top pick among JavaScript Charting Libraries. It’s a testament to our commitment at Designveloper to deliver efficient, high-quality solutions while ensuring a smooth development experience.
Successful Use Cases
We’ve successfully utilized JavaScript Charting Libraries in various projects. Here are two notable examples:
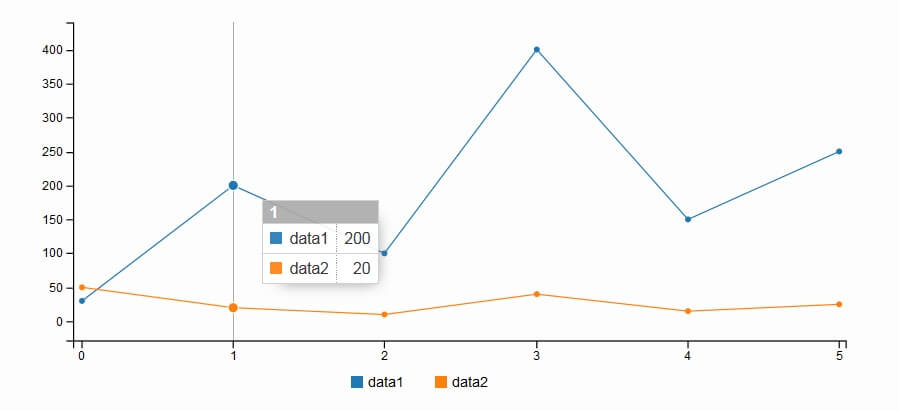
- Aha.is: This e-commerce platform is one of our success stories with Chart.js. We developed a feature that generates line charts, representing store revenue over time. The user-friendly interface allows users to select their desired time range and store, facilitating easy performance evaluation and comparison.
- Personal Blog Website: This personal project showcases our adept use of Chart.js. We integrated the library to generate line charts displaying visit times throughout the day and bar charts comparing views for each blog post. This feature enables clear tracking of content popularity.
These successful use cases demonstrate our proficiency in leveraging JavaScript Charting Libraries to deliver efficient and high-quality solutions. At Designveloper, we’re committed to using the best tools and technologies to meet our clients’ needs.
Thoughts on the Future Trends of JavaScript Charting Libraries
Looking ahead, we at Designveloper believe that the future trends of JavaScript Charting Libraries will be shaped by two key factors:
- Integration with Frontend Frameworks: We anticipate a growing focus on enhancing integration capabilities with popular frontend frameworks such as React, Vue, and Angular. This trend is aimed at optimizing performance with modern web applications, ensuring that JavaScript Charting Libraries continue to meet the evolving needs of developers.
- Enhanced User Interaction: Alongside this, we foresee these libraries augmenting features that support user interaction. This means users will be able to interact with charts in a more flexible and engaging manner, enriching the overall user experience.
These trends underscore our belief that JavaScript Charting Libraries will continue to evolve and adapt, offering developers robust, flexible, and user-friendly solutions for data visualization. At Designveloper, we remain committed to staying abreast of these trends, ensuring we deliver the most effective and efficient solutions to our clients.
FAQs
What are the best JavaScript charting libraries?
There are many great JavaScript charting libraries available, but the choice depends on your needs. Some libraries are better suited for simple charts, while others are more powerful and offer more features.
Is Chart.js the best JavaScript charting library?
Chart.js is a popular and powerful JavaScript charting library. It offers a wide range of features, including support for data exploration and animation. However, it can be difficult to learn and use, so it’s not always the best choice for beginners.
Which is better, D3.js or Chart.js?
Both D3.js and Chart.js are powerful JavaScript charting libraries. The choice depends on your needs and preferences. D3.js is more comprehensive, but Chart.js is easier to use and more popular.
How do you chart in JavaScript?
To chart in JavaScript, you first need to create a chart object. This object will contain the data you want to display on the chart, as well as the parameters that control how the chart is displayed. You can then create charts using the chart() method. We Designveloper hope that this article can help you a lot to know how to use javascript charting libraries!
Also published on

Share post on