
















Key SaaS Metrics: Formulas, Benchmarks, And How To Use Them

SaaS companies should track more than revenue. The key SaaS metrics show whether the product creates value quickly, retains customers, expands within accounts, and grows without consuming too much cash. A useful dashboard connects those signals instead of treating MRR, churn, and CAC as separate numbers.
For most SaaS teams, the starting set is monthly recurring revenue (MRR), annual recurring revenue (ARR), activation, retention, net revenue retention (NRR), customer acquisition cost (CAC), CAC payback, gross margin, and burn. The right emphasis changes as the company moves from product validation to repeatable growth.
What Are Key SaaS Metrics?
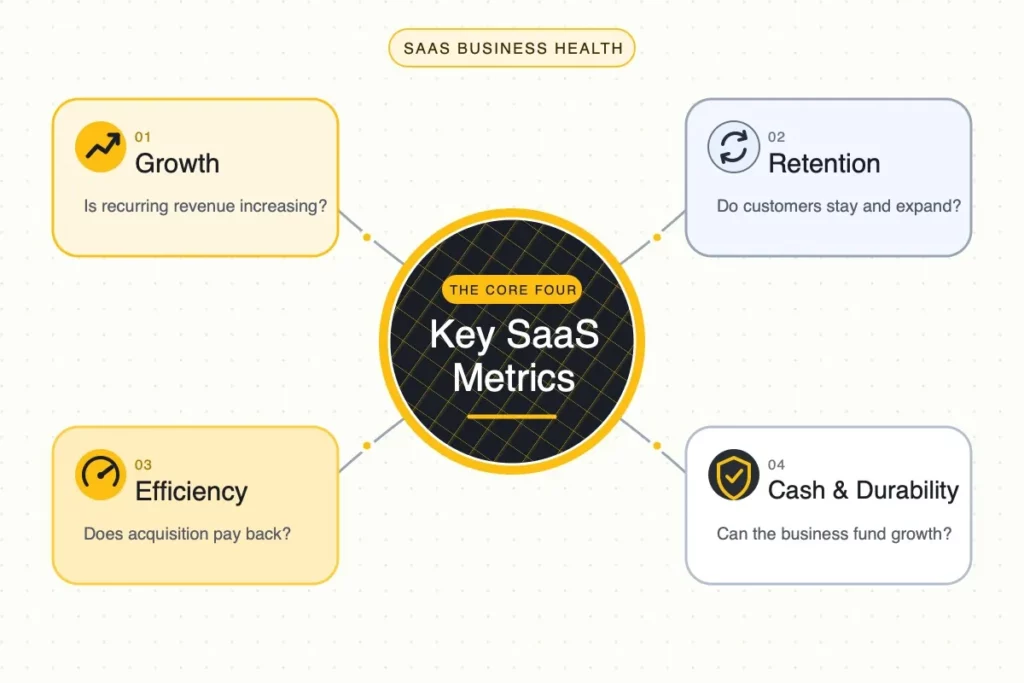
Key SaaS metrics are measures that show the health of a subscription software business. They cover four connected questions:
- Growth: Is recurring revenue increasing, and where does that increase come from?
- Retention: Do customers stay, reduce their spend, or expand their usage?
- Efficiency: Does the business recover the cost of acquiring a customer in a reasonable time?
- Cash and durability: Can the company fund its plan while maintaining a healthy service margin?
No single metric answers all four questions. ARR can rise while churn worsens. A strong NRR can hide an expensive acquisition engine. A low CAC can be misleading if customers never activate. The goal is not to create the biggest possible dashboard. It is to give product, sales, customer success, and finance teams a shared view of the customer lifecycle.
See also: What is a SaaS product?
How to Build a Practical SaaS Metrics Stack
The most practical way to organize key SaaS metrics is by the decision they support. Product metrics are usually leading indicators: they reveal whether users receive value before a renewal or cancellation appears in finance data. Revenue and cash metrics are lagging indicators, but they show whether that value becomes a viable business.
| Decision | Leading indicator | Business result to watch | Typical owner |
|---|---|---|---|
| Improve onboarding | Activation rate, time to value | Trial-to-paid conversion, early retention | Product and customer success |
| Grow existing accounts | Feature adoption, active seats, usage limit reached | Expansion MRR, NRR | Customer success and sales |
| Improve acquisition | Qualified pipeline, conversion by channel | CAC, CAC payback | Marketing and sales |
| Protect cash | Hiring plan, gross margin, infrastructure cost | Burn, runway, burn multiple | Finance and leadership |
This structure prevents a common reporting problem: each team can see its own activity, but nobody can explain how product adoption affects expansion revenue or why a new channel has made payback slower.
See also: SaaS application development process, cost, and architecture
Revenue Metrics That Show the Quality of Growth
Recurring-revenue metrics should use a consistent definition of what counts as recurring. Setup fees, one-off professional services, taxes, and non-recurring usage charges should not be mixed into MRR unless the business has explicitly defined them as recurring subscription revenue.
MRR and ARR
Monthly recurring revenue (MRR) is the normalized monthly value of active subscription revenue. Annual recurring revenue (ARR) is usually MRR multiplied by 12. ARR is helpful for planning and external communication; MRR is more useful for monthly operating reviews.
For example, a $1,200 annual subscription contributes $100 MRR, not $1,200 MRR in the month it is paid. Normalizing contracts this way lets the team compare months without confusing billing timing with growth.
Track the components of change, not just the total:
Net New MRR = New MRR + Expansion MRR - Contraction MRR - Churned MRR
- New MRR comes from first-time paying customers.
- Expansion MRR comes from upgrades, additional seats, higher usage, or cross-sells.
- Contraction MRR comes from downgrades or lower usage.
- Churned MRR comes from cancelled accounts.
This bridge answers a more useful question than “Did MRR increase?” It shows whether growth depends on winning new logos, delivering more value to current accounts, or both.
ACV: compare contracts on the same annual basis
Annual contract value (ACV) is the average annualized value of a customer contract. It is especially useful when the business sells contracts with different terms, including multi-year or ramped agreements. A two-year contract worth $24,000 has an ACV of $12,000, which makes it easier to compare with a one-year contract.
ACV does not replace ARR. ARR describes the recurring-revenue run rate of the business, while ACV helps sales and finance compare deal size, segment performance, and acquisition economics. Used with CAC, ACV helps a team understand the value of the contracts it is acquiring.
Bookings, billings, and revenue are not interchangeable
Teams often use these terms loosely, which makes forecasts difficult to trust.
| Term | What it represents | Why it matters |
|---|---|---|
| Bookings | Contracted customer commitments | Sales pipeline and future contracted value |
| Billings | Amount invoiced during a period | Near-term collections and billing operations |
| Revenue | Amount recognized under accounting rules | Financial reporting and profitability |
| MRR/ARR | Normalized recurring subscription value | SaaS operating health and growth trend |
An annual contract paid upfront can create high billings in one month while adding only one-twelfth of its value to MRR. Finance and go-to-market leaders should agree on these definitions before comparing plan against actuals.
Retention Metrics That Reveal Customer Value
Retention is usually the strongest test of whether a SaaS product solves a durable customer problem. It should be measured both by customers and by revenue because losing a small self-serve account has a different economic impact from losing a large annual contract.
Customer retention and logo churn
Customer retention rate measures the percentage of customers that remain from the start of a period. Logo churn measures the percentage that leave.
Logo churn rate = Customers lost during the period / Customers at the start of the period
Use cohorts when possible. A monthly average can hide the fact that customers acquired in one campaign, industry, plan, or onboarding path churn much faster than the rest. A cohort view helps teams ask a precise question: “Which customers leave, and what happened before they left?”
For B2B SaaS, measure retention against the customer’s renewal cycle. A product with annual contracts may show very little monthly logo churn even when implementation, adoption, or renewal risk is increasing. In that case, monitor onboarding completion, product usage, support volume, executive engagement, and renewal forecast alongside churn.
Gross revenue retention and net revenue retention
Revenue retention focuses on the recurring revenue held by a starting customer group. It is especially important when accounts can expand or reduce their spend.
GRR = (Starting MRR - Contraction MRR - Churned MRR) / Starting MRR
Gross revenue retention (GRR) excludes expansion. It shows how much of the original revenue base the product preserves before upsells offset losses.
NRR = (Starting MRR + Expansion MRR - Contraction MRR - Churned MRR) / Starting MRR
Net revenue retention (NRR) includes expansion. An NRR above 100% means the starting group spends more at the end of the period than at the start, after churn and downgrades. That can be a healthy sign, but it does not make logo churn irrelevant. A business that relies on a few large expansions can still have a weak customer base underneath.
Review retention alongside growth and efficiency rather than treating it as an isolated target.
See also: How AI can improve customer experience
Product Adoption Signals to Watch Before Renewal
Product adoption metrics turn a revenue dashboard into an operating tool. They identify whether a customer has reached the behavior that creates ongoing value.
Activation rate and time to value
Activation is the first meaningful outcome a new user or account achieves. It is not necessarily account creation or a first login. For a reporting tool, activation might be connecting a data source and receiving a scheduled report. For an HR workflow product, it might be completing the first approved leave request.
Activation rate = New accounts reaching the activation event / New eligible accounts
Time to value (TTV) is the elapsed time between signup or purchase and that first meaningful outcome. Shorter TTV is useful only when the activation event actually predicts retention or conversion. Teams should validate that relationship in their own cohort data rather than copying an industry definition.
Engagement and account health
Track engagement at the account level, not only at the user level. A large customer may have many invited users but limited adoption among the people who need the product for a recurring workflow.
Useful signals can include:
- Active seats as a percentage of purchased seats.
- Frequency of the core value action, such as reports generated, cases resolved, or approvals completed.
- Adoption of features associated with retained or expanded accounts.
- Declining usage, unresolved support issues, or a missing executive sponsor.
An account health score can combine these signals, but the score should remain explainable. Customer success teams need to know why an account is at risk and what action may help, not simply see a red or green label.
See also: What is a minimum viable product?
Unit Economics: Can Growth Pay for Itself?
Unit economics connect customer acquisition with the gross profit created after a customer joins. They help leadership decide whether to increase acquisition spend, improve conversion, change pricing, or fix retention first.
Customer acquisition cost and CAC payback
Customer acquisition cost (CAC) is the sales and marketing cost needed to acquire a new customer over a defined period.
CAC = Sales and marketing cost attributed to acquisition / New customers acquired
The calculation is only useful when its scope is consistent. State whether it includes salaries, agency fees, paid media, commissions, events, and sales tools. Also separate blended CAC from channel-level CAC; a low blended number can conceal a channel that is becoming inefficient.
CAC payback period estimates how many months of gross profit from a new customer are needed to recover CAC.
CAC payback months = CAC / Monthly gross profit per new customer
Gross profit matters here. Using revenue instead of gross profit makes payback appear faster than it is, particularly for products with meaningful infrastructure, support, or third-party data costs.
Quick Ratio and Magic Number
The SaaS Quick Ratio shows how much MRR a company adds for each dollar of MRR it loses. It uses the same components as the MRR bridge:
Quick Ratio = (New MRR + Expansion MRR) / (Churned MRR + Contraction MRR)
A ratio below 1 means recurring revenue is shrinking before other adjustments. A higher ratio can signal healthy growth, but it should be read with GRR and NRR. For example, a business can maintain a strong Quick Ratio by adding many new customers while still failing to fix weak retention.
The SaaS Magic Number is a sales-efficiency measure. It annualizes the increase in quarterly revenue and divides it by the previous quarter’s sales and marketing spend:
Magic Number = (Current quarter revenue - Prior quarter revenue) x 4 / Prior quarter sales and marketing spend
Using prior-quarter spend acknowledges the delay between a sales or marketing investment and recognized revenue. This makes Magic Number most useful for a stable, repeatable go-to-market motion; it is less reliable after a large hiring change, a one-off enterprise deal, or a short reporting history.
Gross margin, LTV, and the limits of ratios
Gross margin is the percentage of revenue remaining after direct costs of delivering and supporting the service. The exact cost allocation varies by business, but the team should document its policy and keep it stable enough for trend analysis.
Gross margin = (Revenue - cost of revenue) / Revenue
Customer lifetime value (LTV) estimates the gross profit expected from a customer relationship. A simplified subscription model often uses:
LTV = Average monthly revenue per account x Gross margin / Monthly revenue churn rate
This formula assumes churn is reasonably stable and customer value is consistent. Those assumptions often fail for enterprise contracts, usage-based pricing, or businesses with major expansion revenue. Treat LTV as a planning estimate, not a promise. A cohort-level model based on actual retention and expansion is more reliable once enough history exists.
The LTV:CAC ratio can give a high-level signal, but it should never replace a look at payback, retention, and cash. A ratio can look attractive because the model assumes a long customer lifetime that has not yet been proven.
See also: How SaaS digital marketing agencies help startups scale
Cash Efficiency: Can the Growth Plan Be Funded?
SaaS businesses can grow while becoming harder to fund. Cash metrics ensure that revenue targets are matched with a realistic plan for hiring, acquisition, infrastructure, and product investment.
Burn, runway, and burn multiple
Net burn is the amount of cash the company uses in a period after cash inflows. Runway estimates how long current cash can support that burn rate.
Runway in months = Cash balance / Average monthly net burn
Track runway with a rolling forecast, not only a single monthly division. Annual renewals, delayed receivables, hiring dates, and cloud commitments can change the cash picture quickly.
Burn multiple compares net burn with net new ARR. A common formulation is:
Burn multiple = Net burn / Net new ARR
It indicates how much cash the business spends to add one dollar of annualized recurring revenue. The metric is most useful as a trend and as a planning guardrail. It becomes noisy when net new ARR is small, seasonal, or affected by one unusually large deal.
The Rule of 40 as a portfolio view
The Rule of 40 adds revenue growth rate to profit margin, often using free-cash-flow margin. It is a broad portfolio measure, not a weekly operating target. A young company investing in product-market fit may intentionally fall below it, while a mature company should examine whether it can improve profitability without damaging retention or product quality.
Use this metric to frame a leadership conversation about the balance between growth and efficiency. Do not use it to justify cutting the onboarding, support, or engineering work that protects long-term retention.
Which Key SaaS Metrics Matter at Each Company Stage?
The dashboard should evolve with the company. Early-stage SaaS teams need evidence of product value; later-stage teams need evidence that the model scales.
| Stage | Metrics to prioritize | Decision the team needs to make |
|---|---|---|
| Pre-product-market fit | Activation, TTV, weekly active accounts, customer interviews, trial-to-paid conversion | Does the product solve a painful, repeatable problem for a defined customer? |
| Early growth | New MRR, logo churn, GRR, NRR, sales-cycle length, CAC by channel | Which customer segment and acquisition motion can be repeated? |
| Scaling | Expansion MRR, CAC payback, gross margin, pipeline coverage, forecast accuracy | Where should the company invest to grow efficiently? |
| Mature or enterprise | Renewal forecast, account health, contract concentration, net burn, free cash flow | How can the company protect durable revenue while improving efficiency? |
Customer concentration deserves its own review when a small group of accounts contributes a large share of revenue. It measures the degree to which revenue depends on a small number of customers. Track the share of ARR or revenue held by the largest accounts, then pair it with renewal timing and account-health signals. This does not mean large accounts are undesirable; it makes the risk visible so leadership can plan retention coverage and diversify the customer base.
An illustrative example: a workflow SaaS company sees healthy demo volume but weak trial-to-paid conversion. Before increasing ad spend, the team reviews activation and TTV by acquisition source. If trials from a specific segment activate slowly because data setup is difficult, the better decision may be guided onboarding or an integration improvement. That product change can improve conversion and payback more reliably than buying more traffic.
See also: How lean SaaS development supports product-market fit
How to Turn SaaS Metrics Into Action
Metrics create value only when a team uses them to make a clear decision. A simple cadence works better than a large monthly slide deck that no one owns.
- Review product signals weekly. Look at activation, time to value, core feature adoption, and accounts showing early risk. Assign an owner and a next action for material changes.
- Review growth and retention monthly. Use an MRR bridge, cohorts, logo churn, GRR, NRR, and pipeline conversion to explain the movement in recurring revenue.
- Review cash and unit economics monthly or quarterly. Compare CAC, payback, gross margin, burn, and runway with the operating plan. Refresh assumptions when pricing, channel mix, or cost of revenue changes.
- Investigate metric relationships, not only targets. If NRR falls, check product usage, support issues, contract renewals, and plan mix. If CAC rises, examine conversion by channel and customer segment before changing spend.
Every metric should have a documented definition, data source, owner, review frequency, and action threshold. A metric without those fields may be interesting, but it is not yet useful for operating the business.
See also: A practical data-driven decision-making process
Common SaaS Metrics Mistakes to Avoid
- Using vanity activity as proof of value. Signups, page views, and invitations do not show that an account completed the workflow it bought the product for.
- Measuring churn only at the company level. Segment by cohort, plan, industry, contract size, and acquisition source to find the actual problem.
- Counting expansion to hide weak retention. Review GRR beside NRR so upgrades do not mask lost or downgraded revenue.
- Mixing bookings, cash, revenue, and ARR. Agree on definitions and show each metric for its intended decision.
- Trusting LTV:CAC without checking payback. A model may assume years of retention that the company has not yet earned.
- Changing definitions every quarter. When a definition must change, retain a documented historical comparison so trend lines remain interpretable.
FAQs About Key SaaS Metrics
What are the most important SaaS metrics for a startup?
For an early-stage SaaS startup, start with activation, time to value, retained active accounts, trial-to-paid conversion, new MRR, logo churn, and cash runway. These metrics show whether customers receive value and whether the business has enough time to improve the product. Add CAC payback and NRR when the acquisition and expansion motions become repeatable.
What is a good NRR for SaaS?
There is no universal target because NRR depends on customer segment, pricing model, contract size, and the ability to expand within accounts. NRR above 100% means the starting revenue cohort grew after churn and downgrades. Teams should compare NRR with GRR, customer concentration, and cohort behavior before deciding that expansion is healthy.
How often should a SaaS company calculate churn?
Most SaaS teams review churn monthly, then analyze cohorts on a quarterly basis. Products with high-volume self-serve subscriptions may need weekly monitoring. Enterprise SaaS companies should also review renewal risk throughout the contract cycle because annual churn can appear too late to prevent.
Is ARR more important than MRR?
Neither is automatically more important. ARR is useful for annual planning and communicating the scale of recurring revenue. MRR is more useful for diagnosing monthly changes in new, expansion, contraction, and churned revenue. Use the same recurring-revenue definitions for both.
Use SaaS Metrics to Make Better Product Decisions
The key SaaS metrics are the ones that connect customer behavior to a business decision. Activation and time to value reveal whether a new account reaches the product’s core benefit. Retention and NRR show whether that benefit lasts and expands. CAC payback, gross margin, burn, and runway show whether the growth plan is financially sustainable.
Teams building or improving a SaaS product also need reliable data foundations, user flows, integrations, and reporting before a dashboard can be trusted. Designveloper is an AI-first software and automation partner that helps product teams define those systems and deliver production-ready SaaS applications. Talk to Designveloper about planning a SaaS product, improving a critical workflow, or building the data and product capabilities needed to scale.
Also published on

Share post on










Related Articles



30 Web Development Blogs to Follow and Learn From in 2026
30 Web Development Blogs to Follow and Learn From in 2026 Published July 30, 2026
Key SaaS Metrics: Formulas, Benchmarks, And How To Use Them
Key SaaS Metrics: Formulas, Benchmarks, And How To Use Them Published July 28, 2026
Business Intelligence Examples: 10 Inspiring Use Cases for 2026
Business Intelligence Examples: 10 Inspiring Use Cases for 2026 Published May 04, 2026