














SaaS Cost Breakdown In 2026: How Much Does It Cost To Run A SaaS Product?

SaaS operating cost is the recurring amount you spend to host, maintain, secure, support, and scale a SaaS product. There is no single monthly SaaS cost because the total changes with users, traffic, data volume, uptime targets, integrations, support demand, and compliance requirements. A useful budget separates baseline costs from usage-driven costs, then tracks what each paying customer or tenant costs to serve.
This operating budget is different from the one-time cost to build the product and from customer acquisition spending. If you are still defining the product itself, our guide to SaaS application development explains how scope, architecture, integrations, security, and multi-tenancy affect the build. This article focuses on the recurring cost to run a SaaS product after launch.
What Does It Cost To Run A SaaS Product?
Running a SaaS product means paying each month to deliver, maintain, secure, and support the service. Budget both the baseline capacity you need when usage is low and the metered resources, vendors, and support work that rise with demand.
Do not mix this number with development cost. Building the first release is a project investment, while operating cost repeats after launch. Customer acquisition cost is another separate measure. Sales and marketing spending answers a different question: what it costs to win a customer rather than what it costs to serve one.
SaaS COGS, or cost of goods sold, is narrower than the full operating budget. Public SaaS companies may place direct service-delivery expenses in cost of revenue, but the exact classification depends on accounting policy. A 2026 Zscaler filing with the U.S. SEC, for example, includes customer-support and cloud-operations employee costs in cost of revenue. It also says higher use of its cloud platform can increase bandwidth and data-center expenses.
This distinction matters when you calculate unit economics. A founder may want the full monthly product operating cost for cash planning, while finance may use a narrower COGS definition to calculate gross margin. Use one definition consistently and label it. Otherwise, two cost figures can look comparable even though they include different expenses.
SaaS Cost Breakdown By Expense
A practical SaaS cost breakdown groups expenses by what causes them to change. This makes the budget easier to forecast and reveals which costs can be optimized without weakening reliability.
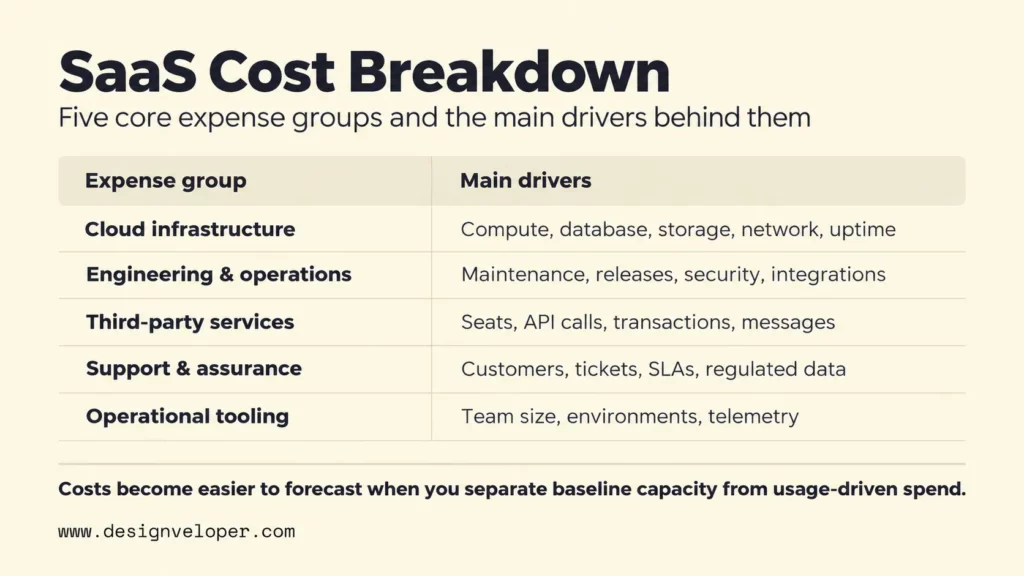
| Expense group | Typical costs | Main cost drivers |
|---|---|---|
| Cloud infrastructure | Compute, databases, object storage, backups, data transfer, CDN, queues, monitoring | Requests, active users, data volume, retention, regions, performance and availability targets |
| Engineering and operations | Maintenance, DevOps, bug fixes, security patches, incident response, technical debt | Codebase complexity, release frequency, integrations, reliability requirements, team model |
| Third-party services | Payment tools, email, messaging, analytics, authentication, APIs, software licenses | Seats, transactions, messages, API calls, events, premium features |
| Support and assurance | Customer support, QA, compliance work, security reviews, backup tests, disaster recovery | Customer count, ticket volume, service commitments, regulated data, enterprise requirements |
| Operational tooling | CI/CD, error tracking, observability, product analytics, collaboration and admin tools | Team size, environments, telemetry volume, retention and tool pricing model |
Cloud cost is often the most visible variable expense, but the bill is easier to control when you separate its drivers. Compute follows processing demand. Database cost follows storage and workload. Network cost follows data transfer. Monitoring cost can rise with telemetry volume and retention.
Use provider calculators when you can describe the workload precisely. The AWS Pricing Calculator can model specific workloads and architecture changes. The Azure Pricing Calculator lets you estimate selected services and usage configurations. The Google Cloud Pricing Calculator similarly lets you configure products and view estimated monthly cost. These tools are more useful than a generic benchmark when your architecture and assumptions are known.
Engineering cost is less visible on the cloud bill, so budget it separately from infrastructure. Releases still need testing, deployment, monitoring, dependency updates, incident handling, and security work. A simple architecture that the team can operate confidently may cost less overall than a fragmented stack with many services. Our cloud application development guide separates delivery cost, operating cost, and change cost so teams can budget beyond the initial deployment.
Third-party services need their own review because pricing can change with usage. Per-message, per-transaction, per-seat, or per-API charges can grow quickly once a service becomes central to the product. Check contracts and pricing tiers before that dependency becomes difficult to replace.
Operational labor also belongs in the model. Automation can reduce manual deployment, monitoring, backup, and incident work, but somebody still owns those systems. If your team is deciding what to keep in-house, our guide to DevOps managed services explains what a provider may handle and what to evaluate before outsourcing operational work.
How SaaS Cost Changes As Your Product Scales
SaaS cost usually grows in steps rather than in a smooth line. Usage-based resources may rise gradually, but new customer expectations can trigger larger jumps in architecture, security, support, and operations.
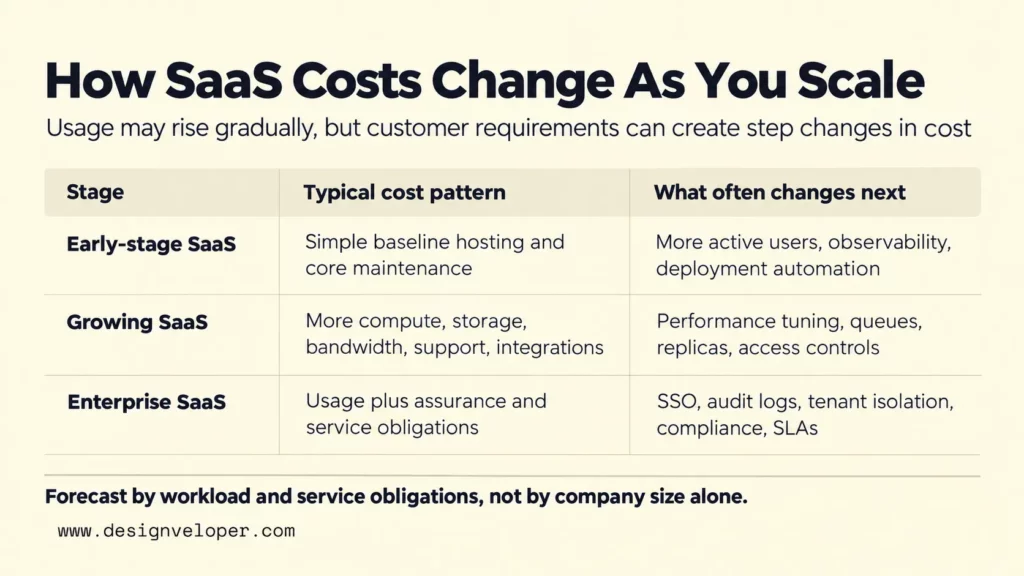
| Stage | Typical cost pattern | What often changes next |
|---|---|---|
| Early-stage SaaS | Baseline hosting, one primary database, essential monitoring, backups, core maintenance, a small set of third-party tools | More active users, larger data sets, first support process, better observability and deployment automation |
| Growing SaaS | More compute, storage, bandwidth, environments, monitoring, support capacity and integration traffic | Performance tuning, queues, caches, replicas, stronger access controls, cost allocation and incident processes |
| Enterprise SaaS | Higher assurance and service costs alongside usage | Redundancy, advanced permissions, SSO, audit logs, tenant isolation choices, compliance, SLAs and dedicated support |
An early SaaS product may keep infrastructure simple because the main goal is to validate one valuable workflow. As usage grows, performance problems become easier to observe. The team can then optimize the actual bottleneck instead of buying capacity in advance. This is also when tenant-level cost visibility becomes useful. A small number of heavy customers can consume much more storage, compute, or support than the average account.
Growth can also increase cost without increasing traffic. A larger customer may require SSO, longer audit retention, a separate environment, custom integrations, stronger recovery targets, security questionnaires, or a contractual response time. Those requirements add engineering and support work even if the tenant has relatively few users.
Our HRM project shows how workflow scope can create different cost drivers without proving a specific project budget. Time-off requests, timesheets, self-service, resource allocation, and centralized data add workflow rules, data, authentication, and support load. The public page does not disclose development or operating cost, so it should not be used to infer a monthly figure.
The practical lesson is to forecast by workload and service obligation, not by company size alone. Two SaaS products with the same number of customers can have very different costs. One may store small records. Another may process video, run AI inference, keep years of audit data, or promise higher availability.
How To Calculate SaaS Cost Per Customer
To calculate SaaS cost per customer, divide the monthly product operating cost you want to analyze by the number of active paying customers in that same month. This gives a portfolio-wide average before you adjust for unusually heavy users or tenants.
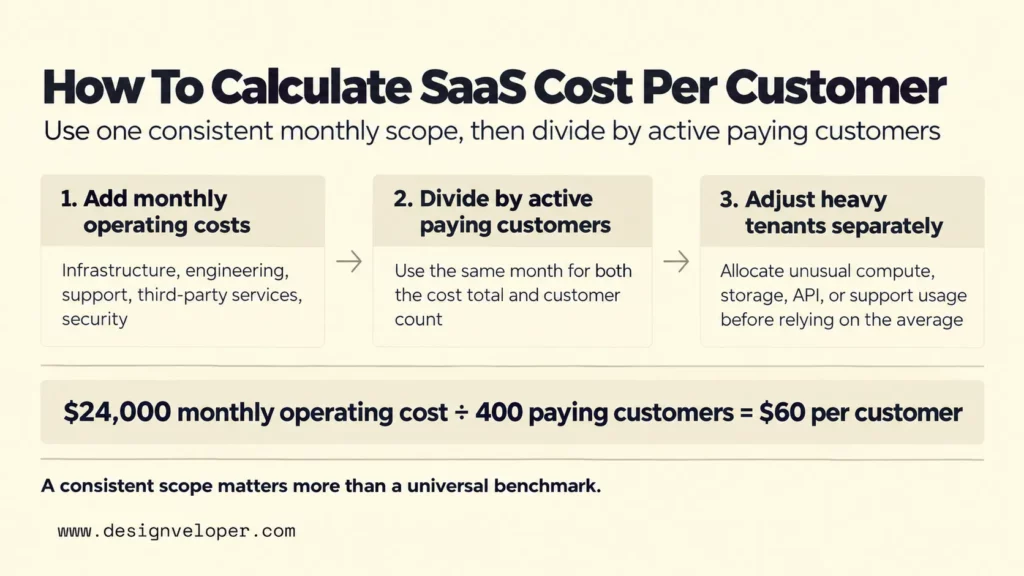
Average monthly operating cost per paying customer = total monthly product operating cost ÷ active paying customers in the same month.
Keep the scope consistent across months. If the goal is product operations, include recurring infrastructure, maintenance engineering, DevOps, support, third-party services, security, testing, compliance, and operational tooling. Exclude one-time build work and sales or marketing unless your internal metric intentionally includes them.
For example, an illustrative SaaS with $24,000 in monthly operating cost and 400 active paying customers has an average operating cost of $60 per paying customer. This is a worked example, not a market benchmark.
For a tenant with unusually high usage, add its measured compute, storage, API, and support costs to an allocated share of common costs. A per-seat SaaS may use active seats instead. A transaction platform may use transactions. The FinOps Foundation’s unit economics guidance makes the same general point: the unit metric should match the business value and cloud investment being analyzed.
Compare cost per customer with revenue per customer and expected usage growth. If an account pays $100 but consistently costs close to that amount to serve, growth can increase revenue while contributing little margin. The response may be technical, such as reducing an inefficient query, or commercial, such as adding usage limits or a pricing tier that reflects expensive behavior.
This internal operating-cost measure is not automatically finance-reported COGS or gross margin. Gross profit is revenue minus COGS, and gross margin expresses that gross profit as a share of revenue. Our guide to key SaaS metrics provides context for recurring revenue, churn, customer lifetime value, customer acquisition cost, and unit economics.
How To Reduce SaaS Operating Costs
The safest way to reduce SaaS operating cost is to remove waste while protecting the service level customers actually need. Start with measured usage, then optimize the largest avoidable driver rather than cutting capacity or tooling blindly.
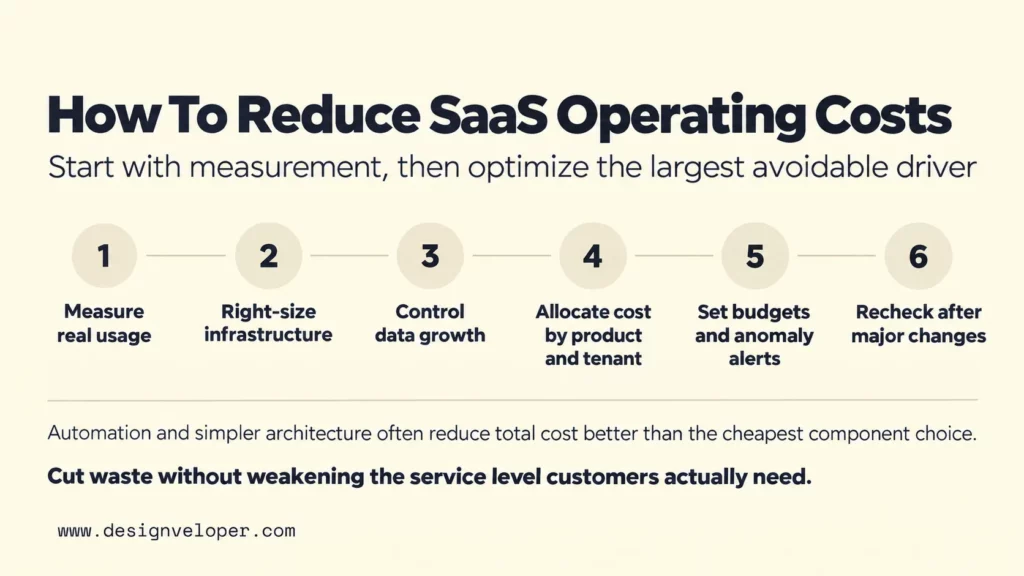
- Right-size infrastructure from real utilization. Review CPU, memory, database load, queue depth, cache hit rate, storage growth, and network traffic. Remove idle resources, shrink consistently underused instances, and scale only the components that are constrained.
- Control data and telemetry growth. Set retention rules for logs, traces, backups, exports, and customer data according to operational, contractual, and legal needs. Old data that has no clear purpose can create storage, indexing, and query costs.
- Make cost visible by product, environment, and tenant. Use cloud labels or tags and a consistent ownership scheme. AWS cost allocation tags support detailed tracking. Google Cloud billing reports can group and filter spend by dimensions such as project, service, SKU, location, or label.
- Set budgets and anomaly alerts. Cost controls should identify unusual spend before the month ends. AWS Cost Anomaly Detection can monitor unusual cost patterns. Google Cloud budgets can send threshold alerts for a defined billing scope.
- Review managed services and third-party subscriptions. A managed database, queue, or monitoring platform can reduce labor, but the premium is worthwhile only when it replaces operational work or risk you would otherwise carry. Remove duplicate tools and unused seats before replacing a service that is doing valuable work.
- Automate repeatable operational work. Deployment, tests, backups, environment creation, and routine cost checks are good automation targets because manual repetition consumes engineering time and increases inconsistency.
- Delay expensive complexity until demand justifies it. Real-time processing, dedicated tenant stacks, multi-region active-active setups, complex AI pipelines, and enterprise controls can be necessary. They should follow a real customer or reliability requirement rather than a hypothetical future need.
Cost optimization is not the same as choosing the cheapest component. For example, a service that saves $500 in cloud spend but adds many hours of manual maintenance can raise total operating cost. Evaluate infrastructure, vendor fees, engineering time, reliability, and switching effort together.
Recheck the budget after every major architecture or pricing change. A new AI feature, large integration, longer data-retention policy, or enterprise support commitment can change cost per customer quickly. The budget should evolve with the product rather than remain a launch-time spreadsheet.
FAQs About SaaS Cost
How Much Does It Cost To Run A SaaS Per Month?
There is no reliable universal SaaS operating cost per month. Build a monthly budget from your actual workload, service commitments, and team costs instead. The template below gives each cost group a place without inventing benchmark figures.
| Monthly budget line | What to enter | Assumption to record |
|---|---|---|
| Baseline infrastructure | Minimum compute, database, storage, monitoring, backups, and other always-on services | Environment count, baseline capacity, region, availability target |
| Usage-driven services | Extra compute, database activity, bandwidth, storage growth, API calls, email, messaging, AI or other metered services | Active tenants, transactions, data growth, messages, requests, model usage |
| Engineering and DevOps | Recurring maintenance, releases, incident work, dependency updates, security fixes, and platform operations | Team time, release frequency, support model, automation level |
| Customer support | Support staff or provider cost and customer-facing operational tools | Active customers, ticket volume, service hours, response commitments |
| Security and compliance | Security tooling, reviews, audits, evidence work, testing, and recovery exercises | Data sensitivity, contracts, certifications, audit cycle |
| Contingency | A planning reserve for usage spikes, incidents, or short-term operational variance | Your chosen planning policy and risk tolerance |
Here is how to use the worksheet with hypothetical numbers rather than market rates. Suppose baseline infrastructure is $4,000, usage-driven services are $2,000, recurring engineering and DevOps are $12,000, customer support is $4,000, and security and compliance work is $2,000. Those five buckets total $24,000 before any separate contingency reserve.
With 400 active paying customers in that same month, the average operating cost is $60 per customer. Replace the example inputs with your provider estimates, staff time, support forecast, and usage assumptions. If one tenant uses much more compute, storage, API capacity, or support than others, allocate those variable costs to that tenant first. Then use the portfolio average for pricing or capacity decisions.
Update the worksheet with production data after launch. Keep contingency separate from the $24,000 example unless you also change the monthly total and recalculate the per-customer result.
What Is The Biggest SaaS Operating Cost?
The biggest cost depends on the product’s stage and workload. For a young SaaS product with modest traffic, engineering and operations may be a larger share than infrastructure. Cloud infrastructure, third-party usage, support, or compliance can become more important as the service scales. Measure your own cost groups instead of assuming hosting is automatically the largest expense.
How Do You Calculate SaaS Cost Per User?
Divide the monthly cost in scope by active users for the same month. Use this only when users are a meaningful unit of consumption. For B2B SaaS, cost per paying customer or tenant can be more useful, especially when one customer has many seats or unusually high storage, transaction, API, or support usage.
Does SaaS Cost Increase With User Growth?
Usually, but not at a fixed rate. More users can increase compute, database activity, storage, bandwidth, support volume, and third-party usage. Good architecture and pricing can improve efficiency as the product grows. Enterprise requirements or heavy customers can also create step changes that make cost rise faster than user count.
Are Hosting Costs Included In SaaS Operating Costs?
Yes. Hosting is a core part of SaaS operating cost and can include compute, databases, storage, data transfer, backups, CDN services, monitoring, and related cloud resources. It is only one category. A complete SaaS cost model should also include maintenance, DevOps, security, third-party services, support, testing, disaster recovery, and other recurring operational work.
Also published on

Share post on










Related Articles


SaaS Cost Breakdown In 2026: How Much Does It Cost To Run A SaaS Product?
SaaS Cost Breakdown In 2026: How Much Does It Cost To Run A SaaS Product? Published September 28, 2026
SaaS Application Development: Process, Cost, And Architecture
SaaS Application Development: Process, Cost, And Architecture Published September 25, 2026
Key SaaS Metrics: Formulas, Benchmarks, And How To Use Them
Key SaaS Metrics: Formulas, Benchmarks, And How To Use Them Published July 28, 2026