


Do you know that over 180 petabytes of data will be generated, copied, and used in 2025, and this figure will continue to increase rapidly in the coming years? It’s a huge combination of structured, semi-structured, and unstructured information that needs a specific method to store, organize, and manage effectively. We define that method as Big Data Analytics. It has become increasingly popular, and businesses now see it as a good way to make money. But what is big data analytics, exactly? Today’s article is the right place where you can find the best answer for this question.
As we’ve already said, we need to process it so it doesn’t go to waste. Theoretically, Big Data Analytics is the systematic use of computers to analyze a large amount of data. You’ve come to the right place if you want to learn more about Big Data Analytics. This article is a very thorough guide to Big Data Analytics.
Recommended reading: How to Increase the Quality of Your Data
What Is Big Data Analytics?
Big Data is a popular term these days. Most people have heard this term at least once, but not everyone knows a lot about what “Big Data” truly means. Previously, businesses used traditional data management systems to store and manage data. These systems would leverage structured, schema-based formats for data storage in a central place and relational databases (e.g., SQL or MySQL) for data manipulation.
Such systems, however, hardly handled complex or vast datasets, often known as Big Data. That’s why Big Data Analytics was introduced to resolve this problem. This approach uses advanced technologies (e.g., statistical analytics, data mining, and machine learning) to analyze data from different sources (e.g., customer transactions or sensor data) and spot hidden patterns or trends in this data.
The Three Vs of Big Data
Big Data keeps getting bigger over time. It is often described by the so-called Vs, which are usually 3Vs: volume, velocity, and variety.
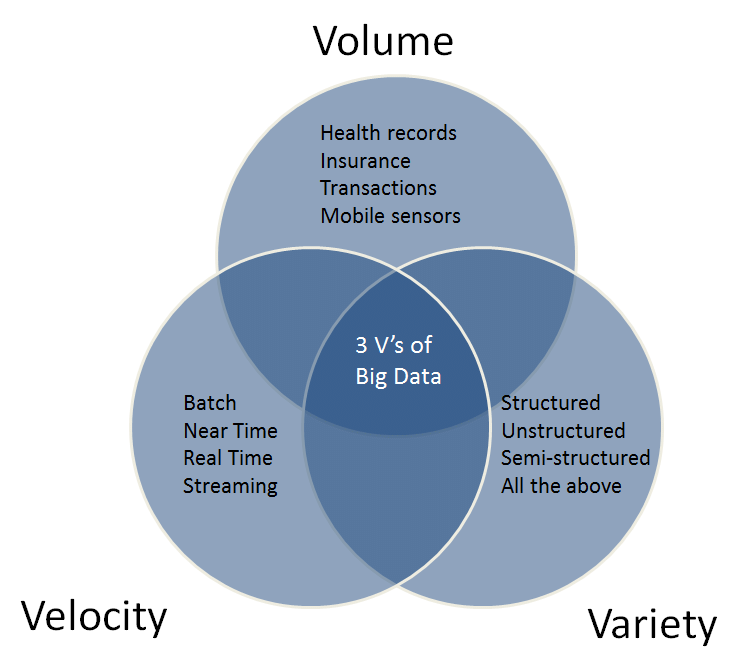
1. Volume
No one knows how much Big Data is yet, and people keep talking about how big it must be to be called “Big Data”. Big Data is always getting bigger and can be any size, from terabytes (TB) to exabytes (EB) and even zettabytes. In short, its huge size surprises us in a way that we may not be able to imagine.
2. Variety
Big Data is a collection of data that comes from many different places and has different formats and categories. Over time, Big Data stores more and more different types of data, such as structured (the traditional type), unstructured (texts, videos, audio, images, etc.), and even semi-structured files like JSON or XML.
3. Velocity
Big Data needs to be processed quickly because of its size, variety, and complexity. Usually, this means it needs to be done in real-time.
In addition to the 3Vs mentioned above, Big Data is also defined by other Vs, like Variability, Veracity, or Value. No matter how we define it, what’s important is how useful and profitable it is.
Recommended reading: Tree Data Structure: A Closer Look
The Nine Stages of Big Data Analytics
Due to its size, Big Data was hard to collect, store, and analyze. In the past, Big Data was a gold mine that proved useless for many companies as there was no effective way to analyze and exploit it for their specific purposes (e.g., increasing customer satisfaction or improving productivity).
But now, this data can be handled with ease by Big Data Analytics. This is the process of looking at different sources of data to find patterns, correlations, and other hidden insights, which are helpful for informed decision-making. Businesses are using Big Data Analytics to help them grow and make good decisions.
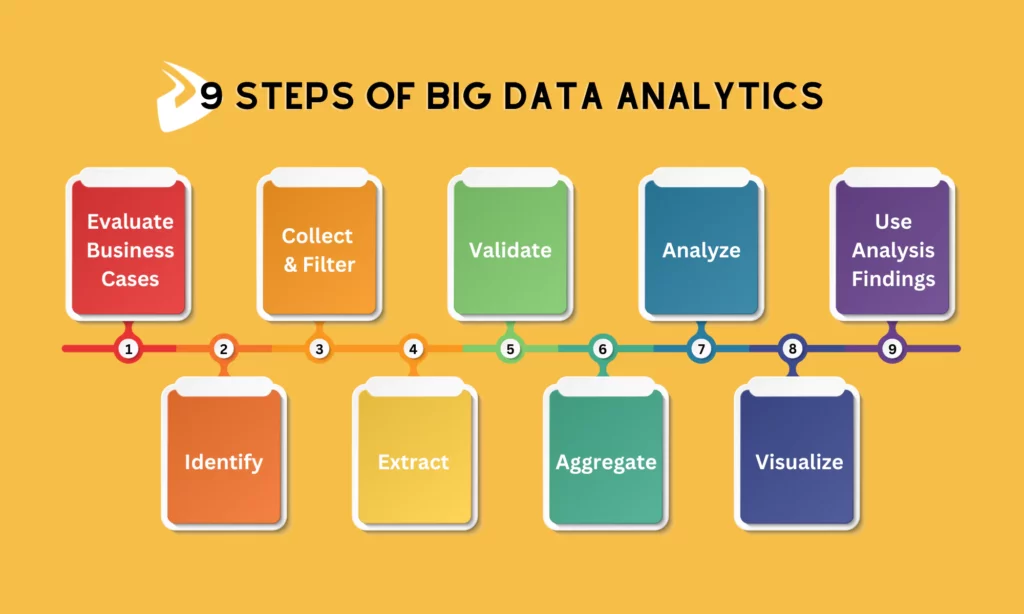
Normally, Big Data Analytics comprises 9 stages as follows:
1. Business Case Evaluation
This is the first step to figure out why or what you want to do with the data. The team that is looking at the data will find out what resources are available and how they can use them. They will also know what problems they may face. So, they can now figure out how much it will cost to do the analysis and avoid wasting money, time, and effort.
2. Identification
Then, the data analytics team will look for related data sets and their sources. This helps them find the right hidden patterns and connections between data variables to resolve their company’s existing problems.
3. Accumulation and Filtering
Once the team has found the sources in the previous stage, they’ll start collecting data from these sources. Useless and meaningless data will be thrown away, though. Additionally, to make this step efficient and quick, the team can leverage programming languages like Python to write scripts and automate the data collection process.
4. Extraction
The format of some of the collected data may not work with the process of analyzing, so different types of data will be extracted and changed into versions that do work.
This includes the conversion of JSON and XML to a readable format in big data formats such as Parquet, Avro, ORC, Delta Table, and different tools like Flexter can help in this.
5. Validation
The data collected may not be organized, may be hard to understand, or may be repeated. Because of this, the team needs to validate it and remove or correct errors that may negatively affect the analytics and findings.
6. Aggregation
Data comes from different data sets and is joined together through fields that are the same, even if the formats are different.
7. Analysis
Data analysts will conduct the analysis over and over again until they discover hidden patterns and connections to answer their current questions.
8. Visualization
Remember, the primary goal of Big Data Analytics is always to make informed decisions based on hidden insights derived from the data. These insights may be used by different departments that have no technical knowledge about data analytics. Therefore, without presenting the data understandably and visually, business users struggle with understanding and commenting on the results of the analysis.
There are many ways to show the findings, like interactive dashboards or graphs. And according to our experience, having data visualization skills is not enough for data analysts to interpret their findings to stakeholders. Essentially, the data analysis team needs to excel at evaluating and communicating these findings well to help stakeholders draw the right conclusions to handle their issues.
9. Use of Analysis Results
Finally, based on the analysis results, different departments within businesses can make informed decisions or improve their workflows. For example, salespeople can leverage these findings to better understand their customers and enhance services accordingly, while management can optimize their operations to make employees more productive.
FURTHER READING: |
1. What Is Data Structure and Their Applications? |
2. What Is Data Classification: Best Practices And Data Types |
3. Data Driven Decision Making: A 7-Step Guide |
The Four Types of Big Data Analytics
There are different data analytics techniques used to exploit large volumes of data. But in general, Big Data Analytics falls into 4 types as follows:
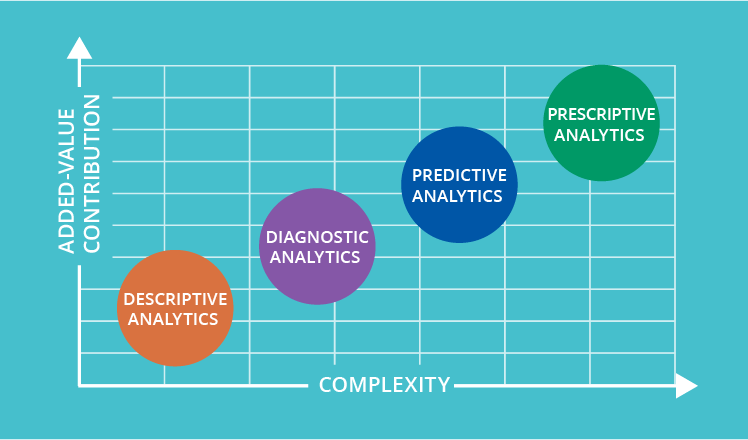
1. Descriptive Analytics
Looking at what happened in the past and making data easy for people to understand.
- Processing, analyzing, and summarizing historical and raw data to make comparisons and draw conclusions that are useful and easy to understand.
- When data mining and data aggregation are used to answer the question “What has happened?”, they look at historical data.
- Graphic patterns like bar charts, pie charts, line graphs, etc., show analytics to build a solid foundation for further analysis.
Example: How Designveloper used descriptive analytics to improve website performance
In one project with an eCommerce website for household appliances, Designveloper’s data analysis team used descriptive analytics to measure the effectiveness of the site’s features. Accordingly, we analyzed customer information and preferences from the site, like page visits, the most used functionalities, or purchase rates.
Based on data analysis, we conducted a thorough evaluation and added essential features to meet customer needs while temporarily hiding unnecessary features. This adjustment led to good results:
- Higher page visits: 100 visits to 20,000 visits per month;
- Longer time spent on the site: average 1.2 minutes to 9.3 minutes per visitor;
- More interactions with new functionality: 70% of users are keen on the search bar and filtering options;
- Higher payment rates: 12% to 33%.
Further, this helped increase the overall sales of our client from the website.
2. Diagnostic Analytics
Getting to the bottom of what made something happen in the past.
- By digging deeper and finding historical data, and then using this data to find connections between events, we can answer the question, “Why did something happen in the past?
- Finding out what data really means and why things worked or didn’t work in the past is important for improving the future and making better decisions.
3. Predictive Analytics
Making predictions about the future.
- Using algorithms to make reasonable guesses about the missing data based on the data that is already available and the correlations between different data sets. It is for figuring out the chances of possible risks, opportunities, or trends and answering the question, “What might happen in the future?”
- It is easier to predict what will happen in the future based on structured data than on unstructured data.
- Using information from the past to make predictions about what will happen in the future. This helps businesses and organizations decide what to do and how to do it.
4. Prescriptive Analytics
Putting forward recommendations and pieces of advice.
- Using descriptive and predictive analytics to come up with options and help answer the question “What should we do?”
- By showing why something is likely to happen, you can suggest what decision to take to take advantage of opportunities and avoid risks.
With the four types of Big Data Analytics, your business can use and analyze historical data to predict the future and know exactly what to do to be more efficient and effective.
Recommended reading: Stacks and Queues in Data Structures: An Overview in 2022
Why Should Your Business Use Big Data Analytics?
Big Data, despite its importance, is just a lot of useless information that needs analysis to make sense. For Big Data not to go to waste, many businesses are now leveraging analysis approaches to get benefits from it or make money off of it. Below are three main reasons why Big Data Analytics is especially crucial for today’s companies:

1. Raising Customers’ Level of Satisfaction
Customers are always the most important factor for businesses. To meet customer needs, it’s best to find out what they really want. Previously, traditional approaches made it hard to harness customer information from massive datasets in CRM systems, social media platforms, and more. But now, Big Data Analytics gives a direct way to learn about customers without having to talk to every single one of them.
Accordingly, your business can use data analytics to collect and look into customer feedback about a product or service you offer. So, you can identify what they like most about your offerings and where to improve, thereby enhancing the quality of your products or services.
2. Enhancing Work Efficiency
Know what “information power” means? In fact, power will go to those who have information and data that others don’t have. Nowadays, what matters is how quickly you can get information. In this situation, we have to talk about Real-time Big Data Analytics. It means that your business can get the most up-to-date information by processing Big Data as it comes in.
Stock charts are a good example. For the most up-to-date information, they need to be updated every minute or even every second. Traders or people who own stocks want to know the most up-to-date information about their stocks so they can make decisions or changes about selling or buying their stocks. If data on stock charts takes too long to show, financial businesses could lose customers. Because of this, the need for Real-time Big Data Analytics is growing.
3. Reducing Costs
Your business can keep costs down by using Big Data Analytics. Particularly, you don’t have to try to ask every customer in person what they think. Instead, you can just look at Big Data and gain valuable insights that way.
One typical example is in the healthcare industry. Today, doctors and healthcare providers can collect patient data in real-time from IoT (Internet of Things) devices, EHR (Electronic Health Record) systems, or telehealth applications. They then use Big Data Analytics to make a quick and accurate diagnosis as well as personalized treatment plans. Meanwhile, patients don’t have to waste time on arriving and queuing at hospitals.
Big Data Use Cases

Recognizing the transformative benefits of Big Data, various giants use analysis approaches to exploit this data for different purposes. It’s not difficult to see use cases of using Big Data nowadays. Let’s take Shopee and Google as examples:
1. Shopee
Shopee can easily figure out what its customers do by looking at their search results and online shopping bills. This is possible because it has Big Data. So, they know which products are more popular, less expensive, and better overall.
During the process of choosing products, they can also make suggestions to the customer. Shopee will suggest things like erasers, rulers, and sharpeners when a customer buys a pencil, for example. By using Big Data Analytics, Shopee provides its customers with the best buying experiences, increasing customer retention and boosting overall sales.
2. Google
Another example is Google. With large volumes of information, Google adopts Big Data Analytics to optimize its search, advertising, and product development. This approach, coupled with advanced technologies like machine learning algorithms, helps Google identify what types of data users are looking for (e.g., statistics or facts) and data reliability to match relevant results with search queries. Further, Google uses Big Data Analytics to optimize its ad-serving algorithms, understand user needs, and discover new trends for product development.
Trends in Using Big Data Analytics
Big Data Analytics has become more popular because it gives users a lot of good things. It becomes an important part of running a business effectively. The growing significance of Big Data Analytics has led to the booming of relevant services and software, with an estimated value of $90 billion in 2025.
Also, because Big Data Analytics is becoming more popular, it gives job seekers a lot of chances to find work. Data-related jobs like data analysts or data scientists are becoming more popular all over the world and pay an average base salary of above $80,000 per year. The candidates must learn about things like the Hadoop ecosystem or NoSQL databases that have to do with Big Data Analytics.
Further, in recent years, we’ve witnessed a growing adoption of AI/ML in Big Data Analytics. Accordingly, these advanced technologies help companies automate data manipulation processes like data cleaning or pattern detection. They also allow users, including even non-technical ones, to conduct predictive and real-time analytics to predict future trends and derive immediate insights. Not only structured data, but unstructured data like social media posts or customer reviews can be analyzed thanks to AI/ML to get deeper insights.
Conclusion
In the end, Big Data Analytics affects every part of life and is a gold mine for any business that wants to exploit it to better understand its customers and improve business workflows. With the assistance of modern technologies like artificial intelligence, data analysis is not as challenging as before. However, whether you’re a data analyst, marketer, or manager who wants to conduct effective data analytics, understanding Big Data Analytics and honing relevant skills are crucial for you.
In case your business is looking for a reliable partner with excellent data analytics skills to improve your site or app, get in touch with us now! Designveloper’s team has extensive expertise and experience to improve your site or app performance.
Also published on

Share post on


Read more topics


You may also like

What Is the Internet of Behaviors (IoB)? Examples, How It Works
What Is the Internet of Behaviors (IoB)? Examples, How It Works Published December 15, 2025
Top 10 Retrieval-Augmented Generation (RAG) Examples By Industry
Top 10 Retrieval-Augmented Generation (RAG) Examples By Industry Published August 19, 2025
RAG Pipeline Diagram: A Beginner’s Guide to How It Works
RAG Pipeline Diagram: A Beginner’s Guide to How It Works Published August 18, 2025