















Android Vs iPhone Users In 2026: Market Share And Survey Insights

KEY TAKEAWAYS:
- Android accounts for more measured mobile OS usage worldwide, while iOS leads in North America; usage share is not a count of unique people or proof of why they choose a phone.
- Income, age, loyalty, and gender findings come from studies with different dates, countries, samples, and measures. They should not be combined into one profile of Android or iPhone users.
- Android covers devices from many manufacturers and price tiers. iPhone users share Apple’s hardware and software ecosystem, but model, region, and service choices still vary.
- Use current local data and direct user research for product decisions. Do not infer an individual’s income, personality, or priorities from their operating system.
A comparison of Android vs iPhone users describes large, varied groups, not two fixed customer types. The apparent difference changes depending on whether a source measures web usage, device ownership, survey answers, or plans to buy again. This article brings the latest market-share snapshot together with older, clearly dated survey evidence, then separates observed platform features from assumptions about people. That distinction helps readers understand what the data can support, and what still needs direct research.
Android Vs iPhone Users: Global And Regional Market Share
In StatCounter’s latest available snapshot during this review, Android had more worldwide mobile OS usage, while iOS had more in North America. The figures below are for August 2026, the latest month shown on September 30, 2026; they are usage-share estimates, not a census of unique phone owners.
| Market | Android | iOS | Period And Meaning |
|---|---|---|---|
| Worldwide | 67.61% | 32.36% | August 2026; usage-share estimate, not unique owners |
| North America | 39.75% | 60.22% | August 2026; iOS led in this region |
| Africa | 81.39% | 18.57% | August 2026; Android had the larger observed share |
StatCounter’s worldwide mobile OS data, North America figures, and Africa figures describe the share of measured usage attributed to each mobile operating system. The percentages do not say how many unique people own a device, how many phones were sold, or why someone selected Android or iPhone. They can also shift with the period, region, site sample, and measurement method.
The regional figures should be compared within the same reporting month. A worldwide estimate cannot stand in for North America or Africa, and the latest available month is not necessarily the current calendar month. Small gaps from 100% can reflect other operating systems or rounding. Keep the source, region, and month beside any figure when reusing it in a report.
Regional usage is useful for sizing a market, but it is not enough to choose a product roadmap. A global app team should check the countries it serves, the devices its customers use, and whether its own analytics represent active users or page visits. A higher operating-system share does not automatically mean higher revenue, stronger engagement, or greater demand for a specific app.
What Surveys Say About Android And iPhone User Demographics
Demographic studies can describe the respondents they sampled, but the available findings here come from different years and populations. Read each row as a bounded result, not a current or universal description of everyone who uses an operating system.
| Measure | Reported Finding | Source Scope | What It Does Not Prove |
|---|---|---|---|
| Salary and technology spending | iPhone respondents reported an average salary of $53,251 and monthly technology purchases of $101; Android respondents reported $37,040 and about $51. | U.S. Slickdeals survey, 2018; 1,000 respondents in each phone group | Current global income, cause of phone choice, or the income of an individual user |
| Main phone by age | 58% of respondents aged 18–34 reported iPhone as their main phone; 53% of those aged 35–54 reported Android. | U.S. survey reported by Statista, December 2021; n=1,783 | Current age patterns outside this U.S. sample or the reason for the difference |
| Brand loyalty | A 2021 SellCell survey reported that 92% of iPhone respondents and 74% of Samsung respondents intended to choose the same brand again. | SellCell survey, 2021; brand-level result | Retention across all Android manufacturers, actual future purchases, or OS-wide loyalty |
| Gender | A Statista chart covers Android and iOS use by gender, but its detailed chart values were not accessible from the source page. | Worldwide chart dated June 2023; page identifies n=56,056 | Any precise gender percentage or an explanation for a difference |
The salary and spending figures come from a 2018 Slickdeals survey announcement. The values are self-reported results from that U.S. survey, not updated income statistics. An app-store revenue analysis measures business revenue, not a phone owner’s personal salary, so it cannot be used to extend those findings.
Salary and technology spending are also separate measures. The monthly purchase figure does not mean that every respondent spent that amount on apps or phones, and it should not be treated as a measure of disposable income. A single survey can show what its respondents reported at that time; it cannot establish that income caused them to choose a particular operating system.
The age figures refer to a U.S. main-smartphone survey from December 2021. Its age groups and country should stay attached to the percentages. The result does not establish how younger or older people behave in other markets or in 2026.
The Statista gender chart identifies a worldwide June 2023 measure, but its chart detail is access-limited. Without verified values, a precise comparison would be misleading. The same boundary applies to explanations that link gender patterns to marketing, operating-system familiarity, or customization: a survey of device use does not establish those causes.
Brand and operating-system loyalty are not interchangeable either. The SellCell 2021 report compares Apple and Samsung brand intentions. Samsung users are one part of the Android ecosystem, and an intention to buy again is not the same as a completed upgrade.
Platform Features That Can Shape User Preferences
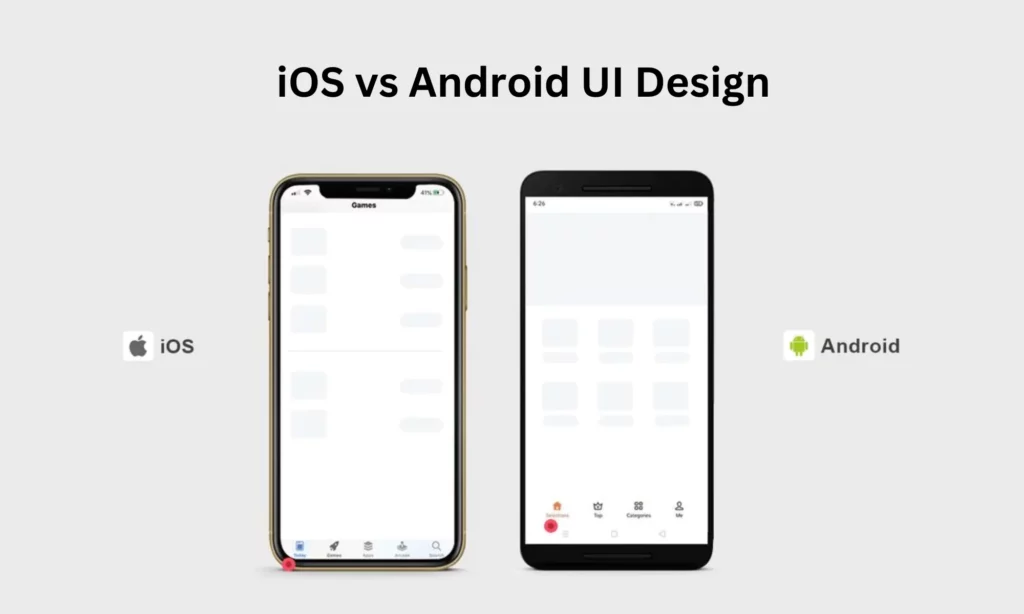
Platform features offer useful comparison points, but they do not reveal why a specific person owns a phone. Android and iOS differ in device choice, system controls, and ecosystem links; the experience also varies by device model, software version, country, and services a person already uses.
- Device choice and price: Android is used across products from multiple manufacturers and price tiers. The iPhone range is designed and sold by Apple. Compare devices in the same country, sales period, and condition; a broad platform label is not a reliable price comparison.
- Customization and defaults: Android and iOS both let people personalize parts of the interface. The available controls and default apps differ by software version and device. Compare a specific task, such as changing a home screen, sharing files, or setting a default app, rather than calling one platform fully customizable and the other closed.
- Connected products and services: A person’s existing computer, tablet, watch, cloud storage, messaging, and workplace tools can affect convenience. That is a fit question to test with the user, not proof that all people in one OS group value the same ecosystem.
- App access and support: App availability, device support, update timing, and store rules can vary. Product teams should check the markets and device models they serve instead of treating Android or iOS as one uniform environment.
For example, a person who shares work files with a team may value compatibility with the team’s tools more than home-screen options. Another person may prioritize device price or accessibility settings. These are research questions for interviews or product analytics; market-share data alone cannot rank them.
Product teams can turn those questions into task tests. Ask participants to complete the same action on each platform, such as finding a recent file, changing an accessibility setting, or restoring an account on a replacement phone. Record completion, errors, and points where help was needed. That shows how the experience differs for the tested people and devices, without turning a small test into a claim about every Android or iPhone owner.
How Current Phone Trends May Affect Platform Decisions
Foldable designs, built-in AI features, and 5G can affect a purchase or product plan, but none defines all Android or iPhone users. Availability changes by device, market, language, carrier, and software release, so compare current products rather than older forecasts or rumors.
- Foldable phones: A foldable can offer a larger screen for reading, multitasking, or media while keeping a smaller outer display. Before treating the form factor as a platform advantage, compare the models currently sold in the target market, app layouts, durability terms, and repair access. An app team should test its own interface at both screen states rather than assume that a phone app will adapt well.
- AI features: Apple describes Apple Intelligence and Siri, while Samsung presents Galaxy AI features for supported devices. Feature sets, model requirements, language support, regional access, and data handling differ. Check each product’s current terms and device list instead of assuming one uniform AI experience. For work tasks, compare the supported language and the steps the feature can actually complete on the selected model.
- 5G: A 5G label does not guarantee the same connection everywhere. Device bands, carrier plan, local coverage, congestion, and the task being performed all matter. Users who mainly browse or message may weigh it differently from people who stream or upload large files often. A product team should test the real service under the networks and locations its customers use, not rely on the network icon alone.
For product teams, the practical test is whether a feature solves a real user task in the intended market. A team can compare supported devices, interview customers about the task, and test the experience under local network and language conditions. Avoid claims about sales growth or platform preference unless a current source measures that outcome directly.
How To Use Android Vs iPhone User Data In Product Research
Use platform data to form a question, then validate it with evidence from the users and market that matter to the product. A short research plan prevents OS share, survey demographics, and customer behavior from being treated as the same measure.
- Name the decision: State whether the team is sizing an audience, prioritizing app support, planning a launch, or researching a feature.
- Choose one measure: Separate OS usage, device ownership, purchase intent, retention, and stated preference. Record the source, denominator, location, and date.
- Match the segment: Compare the same country, age range, device tier, and time period where possible. Do not combine a global usage estimate with a dated U.S. survey and present them as one profile.
- Ask users about reasons: Use interviews, product analytics, support requests, or a well-designed survey to test needs such as price, accessibility, app compatibility, or ecosystem fit.
- Validate the product choice: Check device coverage, core workflows, accessibility, app-store requirements, and ongoing support before deciding which platform to prioritize.
For example, a team considering an app launch in North America and Africa could use the August 2026 snapshot to set an initial research question: which platform mix appears in each market? The team would then compare its own active-user data, recruit participants from those locations, and test the app’s key task on representative devices. The market-share figures help frame the sample; they do not predict conversion, retention, or support cost.
A market-share estimate can help frame reach, but it cannot select the right release strategy by itself. Teams planning platform support can review Android App Development: Stack, Process, Cost, And Best Practices and iOS App Development Languages: Swift, Flutter, React Native for engineering considerations. Those guides address development choices, while this article’s survey and usage data describe user and market signals.
FAQs About Android And iPhone Users
Does Android’s Larger Global Share Mean More People Prefer It?
No. StatCounter estimates mobile OS usage from its measurement data; it does not ask people why they chose a phone. Preference needs a survey or user research designed to measure that reason.
Can OS Market-Share Data Explain Why People Choose A Phone?
No. Usage share describes observed activity, not motivation. Price, device needs, local availability, services, and other factors should be tested with users rather than inferred from the operating system alone.
Should An App Team Choose A Platform Based Only On Global Market Share?
No. Teams should also review their target countries, current customer mix, device support needs, product requirements, and maintenance capacity. Global usage share can inform the question, but it cannot decide the release plan by itself.
What The Evidence Supports
In the August 2026 StatCounter snapshot, Android had the larger worldwide mobile OS usage share, while iOS led in North America. Historical surveys report differences in some U.S. age and spending groups, and a 2021 survey found different Apple and Samsung brand-retention intentions. Each result has a separate population, period, and definition.
The evidence does not support a single Android-user or iPhone-user persona, nor does it prove that income, gender, personality, or loyalty causes someone’s platform choice. Use current regional data to frame market questions, treat older surveys as historical context, and ask the intended users directly before making product decisions.
Also published on

Share post on










Related Articles


How Will AI Affect Software Development? Complete Guide In 2026
How Will AI Affect Software Development? Complete Guide In 2026 Published October 21, 2026
Mobile App Development Process: Seven Stages From Idea To Launch
Mobile App Development Process: Seven Stages From Idea To Launch Published October 20, 2026
TOP 5 iOS App Development Languages: Swift, Objective-C & Cross-Platform
TOP 5 iOS App Development Languages: Swift, Objective-C & Cross-Platform Published October 16, 2026