
















What Is Velocity In Agile? Formula, Examples, And Common

KEY TAKEAWAYS:
- Velocity in Agile shows how much work a team actually finishes in a sprint, usually measured in completed story points rather than hours.
- Teams use velocity to make sprint forecasts, release estimates, and workload decisions based on real delivery history instead of guesswork.
- Velocity is useful for planning, but it should never be treated as a performance target or compared directly across teams.
- The best way to improve velocity is to improve the workflow itself through better story breakdown, stable estimation, lower technical debt, and stronger collaboration.
In Agile, velocity measures the work a team reliably completes in a sprint, usually in story points. It gives teams an evidence-based way to forecast the next sprint without guessing.
See more:
- Agile Vs. Waterfall Vs. Scrum Vs. Kanban: Key Differences
- Agile Vs Scrum: What’s the Difference and When to Use Each?
- What Is Agile Software Development? Methodologies and Benefits
This guide covers the formula, a worked example, planning uses, differences from capacity and productivity, common mistakes, and practical improvement steps. For broader context, see how Agile software development works in practice.
The overview below shows where velocity fits in an Agile delivery workflow.
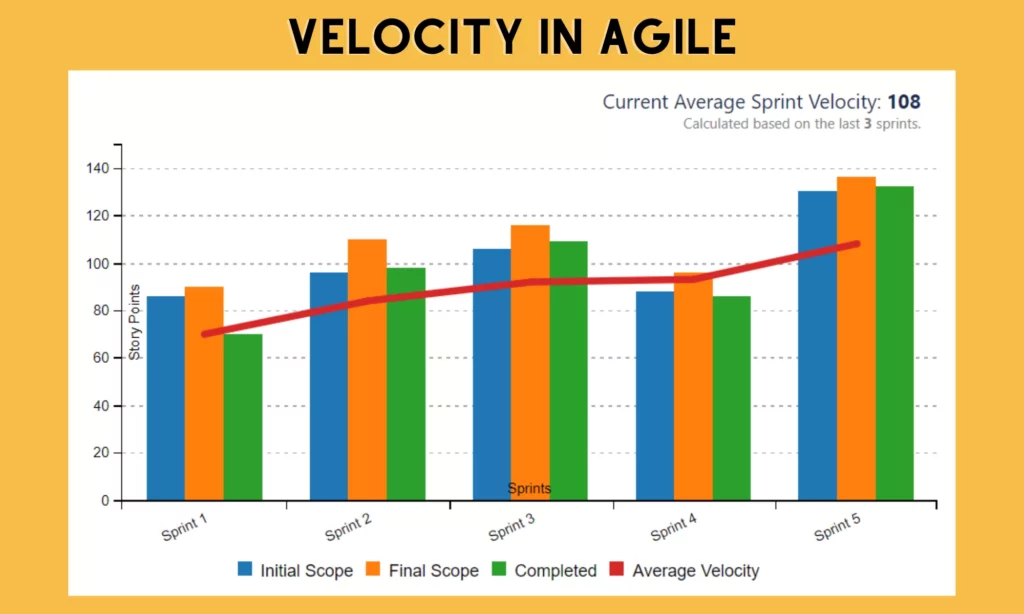
Use it as a planning signal, not as a scoreboard for comparing teams.
What Is Velocity In Agile?
Velocity in Agile is a measure of how much work a team can actually complete during a single iteration, usually a sprint. It’s often calculated based on story points, which represent the effort or complexity of tasks, rather than exact hours. In other words, it helps teams answer the question: “How much can we actually get done?”
This definition lines up with how Agile practitioners commonly use the metric. Agile Alliance’s velocity glossary also frames velocity as a team-level planning measure built from completed work over time, not as a universal score of team worth.
To make this clearer, let’s take this example:
Imagine a team working in two-week sprints. In their first sprint, they complete tasks worth 20 story points. In the next one, they finish 25, and then maybe 22. After a few cycles, their average velocity settles around 22 story points per sprint.
So when planning the next sprint, they won’t just guess. They’ll likely commit to around that number to ensure their workflows run smoothly without burnout. For this reason, the team has a more grounded way to plan instead of overpromising or under-delivering.
Why Agile Velocity Matters
Agile velocity looks simple, yet it plays a crucial role in keeping work realistic and manageable. Below are the visible benefits of Agile velocity:
- Forecast timeline
Velocity helps teams estimate how long a project might take based on real performance, not assumptions. By looking at past sprints, teams can predict how many iterations are needed to complete their remaining work. The estimate is never perfect, but it is far more useful than a vague timeline detached from delivery history.
- Control workload
Instead of overloading a sprint with too many tasks, teams use velocity to set a realistic limit. If a team’s average velocity is around 25 story points, committing to 40 would probably be optimistic at best. This helps prevent burnout and keeps the pace sustainable over time, especially in structured Scrum environments.
- Improve planning
Over several sprints, velocity becomes a reliable reference point for planning future work. Teams accordingly start to understand their delivery pattern better, which leads to more consistent commitments. More importantly, it builds trust with stakeholders because plans are based on actual data, not just best guesses.
How To Calculate Agile Velocity (Formula + Examples)
So, how can your team calculate Agile velocity? Below is the basic formula, a few practical rules, and an example to help you calculate Agile velocity effectively.
Agile Velocity Formula
At its simplest, Agile velocity is calculated using this formula:
Velocity = Total Story Points Completed / Number of Sprints
Here’s how Agile teams typically gather numbers and calculate Agile velocity:
- Choose recent sprints: Select a few completed sprints, usually the last 3 to 5.
- Add up completed story points: For each sprint, count only the story points tied to tasks that are fully completed. Not “almost done,” not “in review,” but only work that meets the team’s definition of done.
- Calculate the average: Once you have the total, divide it by the number of sprints you included. That result is your team’s average velocity.
When calculating Agile velocity, you should remember a few important rules as follows:
- Only count fully completed work: If a task is unfinished, it doesn’t count. This keeps the metric honest.
- Velocity is team-specific: You really shouldn’t compare velocity across teams. Different teams estimate story points differently, so comparisons can be misleading.
- Consistency matters more than spikes: One unusually high or low sprint doesn’t define your velocity. What you’re looking for is a stable trend over time.
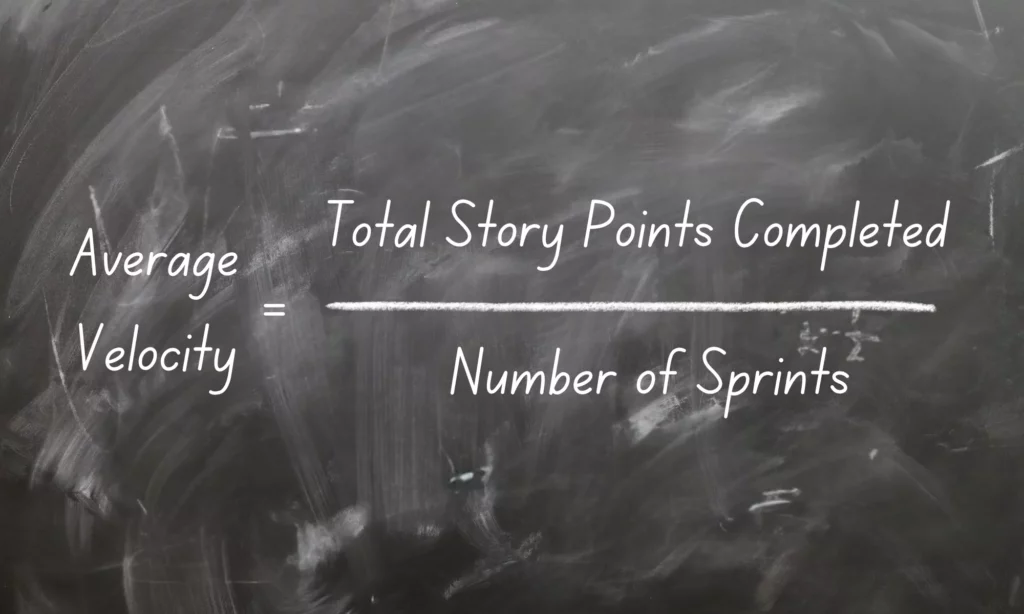
The same calculation becomes more useful when it reflects several recent sprints rather than one unusually smooth or disrupted cycle.
Example Of Agile Velocity Calculation
Now, let’s take an example to better understand how Agile velocity is calculated in real projects:
Imagine your team has completed four sprints with the following results:
| Sprint 1 | 20 points |
| Sprint 2 | 25 points |
| Sprint 3 | 22 points |
| Sprint 4 | 18 points |
| Total | 85 story points |
Now divide that sum of completed story points by 4 sprints: 85 ÷ 4 = 21.25
In practice, teams might round that number or treat it as a range, say 20–22. So, your average velocity is roughly 21 story points per sprint. This means your team can plan work that equals the effort and complexity of about 21 story points per sprint.
Further reading:
- What Is Agile Project Management? Benefits & Best Practices
- Agile Sprint Planning: Definition and Generic Guides
- Agile Software Development Life Cycle Guide
Those guides help connect a stable velocity to the wider sprint, release, and delivery cycle.
How Agile Teams Use Velocity In Planning
So, once you’ve calculated velocity, what do you actually do with it? This is where Agile velocity becomes useful as a practical planning tool that helps teams make smarter, more realistic decisions about upcoming work.
- Sprint forecasting
Teams use velocity to decide how much work to pull into the next sprint. If the average velocity is around 21 story points, committing to something close to that number helps avoid overloading the team. It’s not a strict limit, but it keeps expectations realistic.
- Release planning
Velocity also helps estimate how long it might take to complete a larger set of features or an entire project. By dividing the total backlog size by the team’s average velocity, teams can get a rough idea of how many sprints are needed. Atlassian’s velocity in Scrum guide describes this kind of forecasting as one of the main practical uses of the metric.
- Reading trends
Velocity can also reveal patterns over time. Is the team becoming more consistent? Are there sudden drops or spikes? These trends can signal underlying issues, like bottlenecks, changing team capacity, or improvements in workflow.
So, velocity doesn’t just help teams plan forward. When looking further, teams can adopt it to reflect on their workflow and adjust along the way.
Velocity Vs Capacity Vs Productivity In Agile
In Agile project management, teams often mix up these three terms: velocity, capacity, and productivity. These terms are related, but they’re not interchangeable and serve different purposes accordingly. Understanding the differences between them and how they connect helps teams use them better in planning.
Velocity Vs Capacity
Velocity is the average amount of work a team actually completed in past sprints, measured in story points. Meanwhile, capacity is the number of work hours a team has for an upcoming sprint, based on available time and resources like team size, working days, and time off.
They both help with planning. But one is based on past performance, while the other is more about current availability.
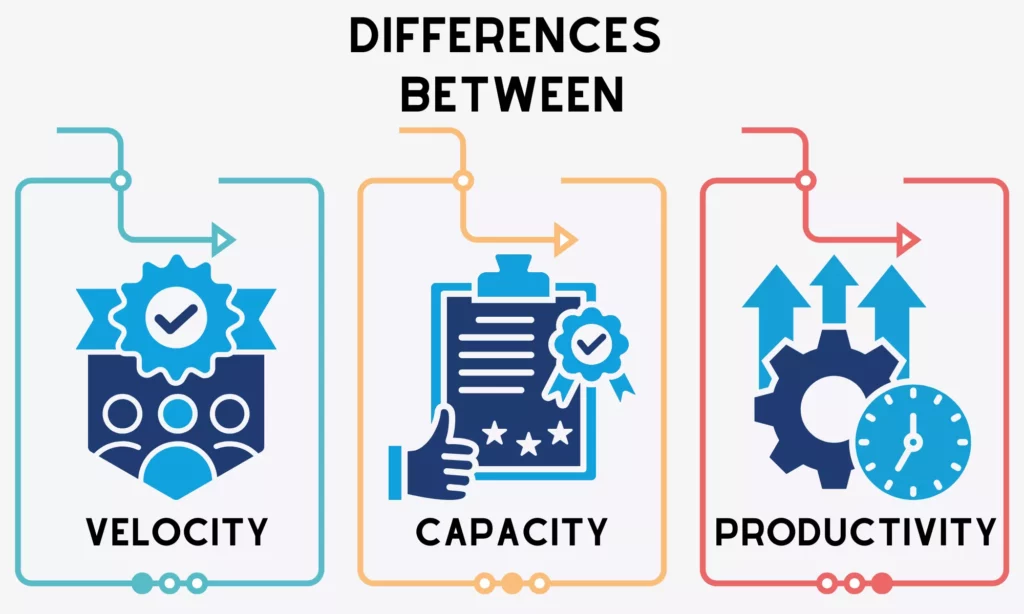
The comparisons below show why teams need both historical delivery data and current delivery context.
The comparison table will help you better understand the key differences between these terms:
| Aspect | Velocity | Capacity |
| Focus | The amount of work a team has actually completed in previous sprints. | The number of work hours a team has in an upcoming sprint. |
| What It Reflects | Real performance and delivery patterns over time. | Team availability (who’s working, how many days, any time off, etc.). |
| Basis | Historical data from past sprints. | Current conditions and team situation. |
| Unit Of Measurement | Story points (effort, complexity, uncertainty combined). | Hours, days, or total available effort. |
| Purpose In Planning | Helps forecast future performance. | Plans the workload for the next sprint. |
| Level Of Reliability | Becomes more reliable over time as more sprint data is collected. | Can fluctuate frequently due to changes in team availability. |
In practice, many Agile teams don’t use velocity and capacity separately but combine them to create more realistic sprint commitments.
A common approach is to start with historical velocity, what the team has consistently delivered, and then adjust it based on current capacity, who’s available this sprint, to calculate the target velocity. The following formula tells it all:
Target Velocity = Average Velocity x (Current Capacity / Historical Capacity)
For example, if your team’s average velocity is 25 story points but capacity drops to 80% due to vacations or meetings, a more realistic target would be around 20 story points.
Velocity Vs Productivity
Many teams often treat velocity as if it measures productivity. But in fact, they serve different purposes. Velocity measures how much work is completed in story points, while productivity refers to how efficiently a team turns effort into valuable output.
The comparison table tells you clearly how different they are:
| Aspect | Velocity | Productivity |
| Definition | The total amount of work completed in a sprint (in story points). | How efficiently a team turns effort into meaningful, valuable outcomes. |
| Focus | Quantity of work delivered. | Value and efficiency of the work delivered. |
| Measurement | Quantitative, based on story points completed. | Often qualitative or outcome-based (customer value, impact, quality). |
| Purpose In Agile | Used for sprint planning and forecasting future work. | Used to reflect on effectiveness and improvement. |
| Risk Of Misuse | Assuming higher velocity always means better performance. | Hard to measure consistently, can become subjective. |
| Real-World Interpretation | “We completed 25 points this sprint.” | “Did those 25 points actually matter?” |
With those differences, we clearly see that high velocity doesn’t mean high productivity. A team may have high velocity but low productivity if they complete many story points that don’t deliver real value, like unnecessary features or rework. Conversely, a team could show lower velocity but high productivity if they focus on fewer, high-impact tasks that truly matter.
Related reading:
- What Is An Agile Framework? Definition, Types And Examples
- Scrum Software Development Turns Change Into Working Software
- The 12 Agile Principles and 4 Agile Values of the Agile Manifesto
Keeping the framework and principles clear helps teams interpret velocity within their chosen delivery method.
So, velocity is useful, but it shouldn’t be used as a performance metric. It tells you how much work gets done, but not how well or how valuable that work is.
What Affects Agile Velocity
Agile velocity can be influenced by several factors. Looking at what affects this metric, Agile teams can evaluate velocity correctly and see whether every fluctuation means something wrong:
- Team size
Changes in team size can directly affect velocity. Adding more members might either increase or reduce capacity because new people need time to onboard and sync with the team. Meanwhile, if key members leave or are unavailable, velocity can drop quickly.
So, when velocity drops from 22 to 18 story points, it doesn’t mean the team is performing worse. It might simply reflect changes in team availability or the time needed for new members to get up to speed.

Review those team changes before treating a velocity drop as a performance problem.
- Complexity
Not all work has the same level of complexity. A sprint filled with highly complex or uncertain tasks will likely result in lower velocity, even if the team is working just as hard.
- Technical debt
Accumulated technical debt can slow teams down over time. Instead of focusing purely on new features, teams may need to spend effort fixing bugs, refactoring code, or dealing with fragile systems. This hidden work often reduces the number of story points completed.
- Interruptions
The final factor is unplanned work or events interrupting workflows and hence indirectly reducing the number of work items completely done. These interruptions may involve urgent bug fixes, production issues, or unexpected meetings. They eat up the team’s available time, making it harder to complete planned tasks and maintain consistent velocity.
For practical examples, check out:
- What Is an Epic in Agile? How to Write It (Guide & Examples)
- What Is Agile Acceptance Criteria? Definition, Examples
- Agile Methodology Sample: Real Examples & Success Stories
Clearer work structure and completion criteria make velocity easier to interpret from sprint to sprint.
Common Mistakes When Using Velocity In Agile
Velocity is useful, but it’s easy to misuse. And that misuse can lead teams in the wrong direction, even when the numbers look “good” on paper. So, you should learn about the common mistakes teams often make when using velocity in Agile, the reasons behind them, and how to avoid them.
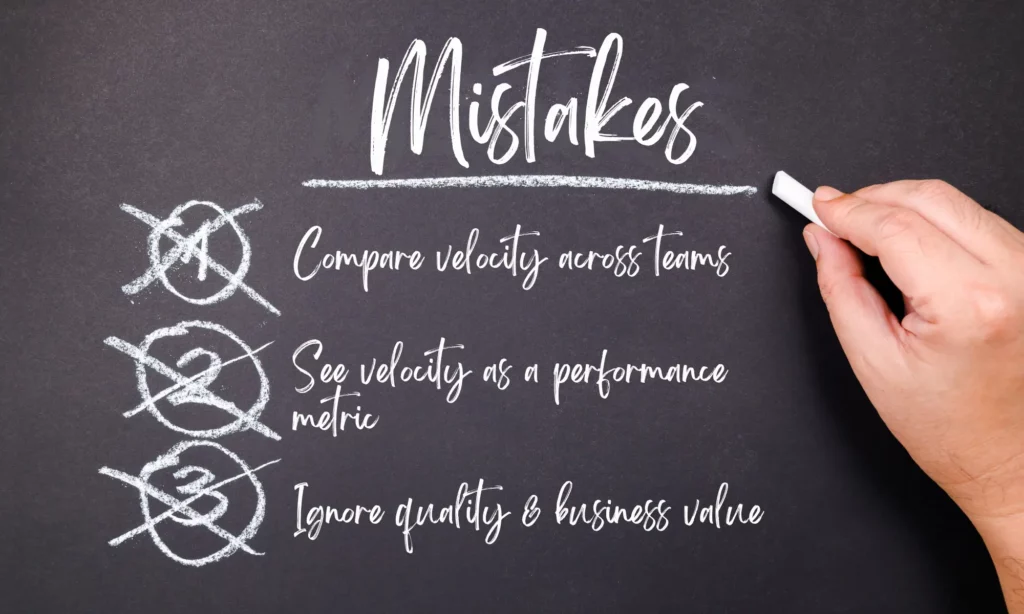
The three mistakes below usually appear when teams treat a planning signal as a judgment of people or output.
Comparing Velocity Across Teams
Comparing velocity across teams isn’t seemingly something wrong. You may think that if Team A delivers 40 story points per sprint and Team B delivers 25, Team A must be more productive. But it’s not really correct.
When diving deep, you’ll soon realize that this cross-team comparison itself is a problem. Story points are relative, not standardized. Each team estimates work differently based on their own understanding, experience, and context. Not to mention that their team size, work complexity, and interruptions are different, leading to different velocity numbers.
So one team’s “5 points” might be another team’s “8” or even “3.” That makes direct comparisons unreliable and even misleading.
For example, imagine two teams working on similar features. Team A reports a velocity of 40, while Team B reports 25. But Team A uses broader estimates, larger point values, while Team B breaks work into smaller, more detailed tasks. In reality, both teams might be delivering at a similar pace, but they just measure their work completion differently.
How to overcome this mistake:
- Look at whether each individual team’s velocity is stable or improving over time, as consistency matters more than size.
- Compare planned and completed work, often called the say-do ratio, to see how predictable a team is.
- Evaluate outcomes teams deliver, such as features released, customer impact, and quality improvements, instead of just velocity numbers.
Turning Velocity Into A Performance Target
One common mistake is seeing velocity as a performance goal. This implicitly encourages teams to improve their velocity numbers, which they misinterpret as a signal of significant progress.
But the scenes behind may not show that. Teams may prioritize easier tasks or break down work into unnecessarily smaller tasks just to complete more points. In some cases, considering velocity a performance target can decrease quality because teams focus on hitting a number instead of delivering true value.
How to overcome this mistake:
- Use velocity as a planning tool to measure output, not a goal for performance improvements.
- Track metrics like customer satisfaction, feature adoption, or business impact to measure performance.
- Encourage teams to adopt a stable, predictable velocity rather than a constantly increasing one.
- Support team improvement qualitatively by using retrospectives to identify bottlenecks, communication gaps, or workflow issues.
Ignoring Quality And Business Value
Many Agile teams also focus on how much work gets done while overlooking what kind of work is being delivered. This means they might hit high velocity numbers, but the output is full of bugs or doesn’t meet user needs.
Velocity doesn’t inherently account for quality or impact. So if teams ignore quality and business value when calculating it, they risk optimizing for the wrong thing.
How to overcome this mistake:
- Combine velocity with quality metrics like defect rates, rework, or test coverage to ensure standards are maintained.
- Prioritize high-value work in the backlog to focus on features that deliver real user or business impact.
- Incorporate feedback loops, like regular reviews and user feedback, to validate whether delivered work actually matters.
How To Improve Agile Velocity
Improving Agile velocity here doesn’t mean constantly increasing the number itself. Instead, teams should focus on improving how work gets done by making processes smoother, reducing inefficiencies, and removing common blockers. When those things improve, velocity tends to follow naturally.
Below are some practical ways to do that:
- Break down user stories
Large, vague tasks will slow everything down. By breaking down user stories into smaller, more manageable pieces, teams can complete work more consistently within a sprint.

Smaller, well-understood items also make spikes and drops easier to explain during planning.
- Reduce technical debt
Handling technical debt, for example through regular refactoring or code cleanup, keeps the system maintainable. But spending too much time on this act can reduce the number of completed work items. Meanwhile, ignoring technical debt may improve velocity in the short term, but it usually backfires later.
So, instead of ignoring technical debt completely, try to reduce it wisely by allocating time, for example 20%, for debt reduction in every sprint, treating the debt as a backlog item, and prioritizing the code portions that cause the most bugs.
- Improve team collaboration
Communication gaps can quietly eat up time. When teams collaborate well, they resolve issues faster and avoid unnecessary delays. But improving team collaboration here doesn’t mean holding as many meetings as possible, but focusing on how teams communicate and work in sync.
- Maintain consistent estimation
Velocity becomes meaningful only when estimation is consistent. If story points are assigned randomly or change significantly from sprint to sprint, velocity loses its value as a planning tool. Use shared understanding and reference points, and teams can keep estimates stable.
You might also like:
- What Pair Programming Means In The Age Of AI Pair Programmers
- Project Management System: Top 10 Core Components
- 20 Software Project Management Methodologies for Software Development
Together, these practices support a predictable delivery rhythm instead of an artificial increase in points.
FAQs About Velocity In Agile
What Is The Velocity Of A Sprint?
The velocity of a sprint is simply the total amount of work a team completes during that specific sprint, usually measured in story points. It only includes tasks that are fully finished, and anything incomplete doesn’t count, even if it’s 90% done.
What Is The Difference Between Burndown And Velocity?
Velocity and burndown charts serve different purposes. Accordingly, velocity shows how much work a team completes per sprint, a measure of output over time. Meanwhile, burndown charts focus on how much work remains within a sprint or release, a measure of progress toward completion. In real projects, teams often use both together by using velocity for planning and burndown for day-to-day tracking.
What Is Good Velocity In Scrum?
A good velocity doesn’t refer to exact numbers, but a consistent and sustainable measure of completed work for a specific team over time. For example, if a team consistently delivers around 20 or even 40 story points per sprint, that’s a good velocity for them. This consistency ensures reliable forecasting.
Why Does Velocity Change From Sprint To Sprint?
Velocity changes over sprints due to various factors. Changes in team size, task complexity, technical challenges, or even unexpected interruptions can all affect how much work gets completed. Velocity variation isn’t something bad. Instead of just looking at velocity numbers and small sprint-to-sprint changes, teams should observe overall trends.
Is Higher Velocity Always Better In Agile?
Not really, and this is where people often get it wrong. A higher velocity doesn’t always mean better performance. More particularly, when teams complete more work items, it doesn’t mean they work better.
Teams can increase velocity by inflating estimates, rushing work, or prioritizing easier tasks. But that doesn’t guarantee higher quality or better outcomes. In some cases, it can actually lead to more bugs or rework later.
So, instead of chasing higher numbers, teams should aim for steady, reliable velocity. This helps reflect real progress and deliver meaningful value.
Conclusion
Velocity is a crucial metric that every team should learn when adopting Agile approaches. It measures how much work a team can complete in a sprint, usually based on story points, and helps teams plan with more confidence over time. When used correctly, it becomes a reliable tool for future planning.
If your team is looking for a delivery partner that can put Agile planning into practice, Designveloper can help.

As a software development and IT consulting company in Vietnam, we’ve applied Agile approaches like Scrum and Kanban to build scalable SaaS platforms, web apps, and mobile apps. Our teams combine Agile with professional techniques like pair programming, continuous feedback loops, and project management tools like Jira to keep development fast while maintaining code quality.
With experience across modern technologies, including artificial intelligence, we help clients build digital products that deliver real value to end users and streamline internal workflows. If you want to discuss your product roadmap, delivery model, or scaling plan, our AI development services can support that next step.
Whether you’re looking to develop from scratch or modernize an existing system, contact us and let’s turn your ideas into real products.
Also published on

Share post on










Related Articles



Agile And Lean: Differences, Similarities And When To Use Each
Agile And Lean: Differences, Similarities And When To Use Each Published October 13, 2026
What Are Agile Acceptance Criteria? Definition and Examples
What Are Agile Acceptance Criteria? Definition and Examples Published October 13, 2026
Setting Up Asterisk PBX: Install and Configure Asterisk
Setting Up Asterisk PBX: Install and Configure Asterisk Published October 12, 2026